Cape Cod Co-operative Bank Mortgage Rates, Fees & Info
Yarmouth Port, MALEI: 549300TXW4YZE1CSWA75
Tax ID: 04-1148930
Latest/2024 | 2023 Data | 2022 Data | 2021 Data | 2020 Data | 2019 Data | 2018 Data
Jump to:
Mortgage Data
Bank Data
Review & Overview
Cape Cod Co-operative Bank is a smaller bank specializing in Home Purchase and Cash Out Refi loans. Cape Cod Co-operative Bank has a high proportion of conventional loans. Their top markets by origination volume include: Barnstable Town, Boston, Worcester, Vineyard Haven, and Providence among others. We have data for 6 markets. (Some data included below & more in-depth data is available with an active subscription.)Cape Cod Co-operative Bank has an above average approval rate when compared to the average across all lenders. They have a below average pick rate when compared to similar lenders. Cape Cod Co-operative Bank is typically a low fee lender. (We use the term "fees" to include things like closing costs and other costs incurred by borrowers-- whether they are paid out of pocket or rolled into the loan.) They typically have about average rates.
We show data for every lender and do not change our ratings-- even if an organization is a paid advertiser. Our consensus data does have lag, but it is highly correlated to a lender's rates & fees relative to their markets. This means that if a bank is a low fee/rate lender the past-- chances are they are still one today. Our SimulatedRates™ use advanced statistical techniques to forecast different rates based on a lender's historical data.
Mortgage seekers: Choose your metro area here to explore the lowest fee & rate lenders.
Mortgage professionals: We have various tools to make your lives easier. Contact us to see how we can help with your market research, analytics or advertising needs.
Originations
438Origination Dollar Volume (All Markets)
$130,750,000Employee count
162Awards
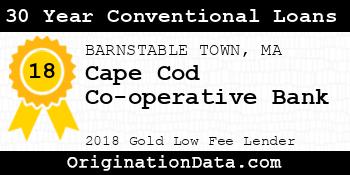
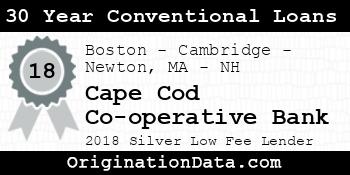
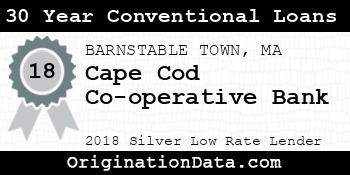
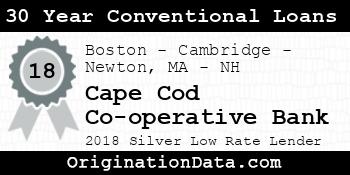
Cape Cod Co-operative Bank - 2018
Cape Cod Co-operative Bank is a 2018 , due to their low .
For 2018, less than of lenders were eligible for this award.
Work for Cape Cod Co-operative Bank?
Use this award on your own site. Either save and use the images below, or pass the provided image embed code to your development team.
Top Markets
Zoom/scroll map to see bank's per metro statistics. Subscribers can configure state/metro/county granularity, assorted fields and quantity of results. This map shows top 10 markets in the map viewport, as defined by descending origination volume.
| Market | Originations | Total Value | Average Loan | Average Fees | Average Rate |
|---|---|---|---|---|---|
| BARNSTABLE TOWN, MA (FHA|USDA|VA) | 403 | $120,935,000 | $300,087 | $2,549 | 4.29% |
| Boston-Cambridge-Newton, MA-NH (FHA|USDA|VA) | 28 | $8,180,000 | $292,143 | $2,887 | 4.18% |
| WORCESTER, MA-CT (FHA|USDA|VA) | 2 | $840,000 | $420,000 | $5,196 | 5.38% |
| Vineyard Haven, MA (FHA|USDA|VA) | 1 | $365,000 | $365,000 | $3,752 | 4.38% |
| Outside of Metro Areas | 1 | $255,000 | $255,000 | $0 | 4.50% |
| PROVIDENCE-WARWICK, RI-MA (FHA|USDA|VA) | 3 | $175,000 | $58,333 | $0 | 4.88% |
Their top states include:
Similar Lenders
We use machine learning to identify the top lenders compared against Cape Cod Co-operative Bank based on their rates and fees, along with other useful metrics. A lower similarity rank signals a stronger match.
Similarity Rank: 23
Similarity Rank: 38
Similarity Rank: 60
Similarity Rank: 66
Similarity Rank: 66
Similarity Rank: 99
Similarity Rank: 110
Similarity Rank: 111
Similarity Rank: 128
Similarity Rank: 147
Product Mix
| Loan Type | Originations | Total Value | Avg. Loan | Avg. Fees | Avg. Rate |
|---|---|---|---|---|---|
| Conventional | 438 | $130,750,000 | $298,516 | $2,570 | 4.30% |
For 2018, Cape Cod Co-operative Bank's most frequently originated type of loan was Conventional, with 438 originations.
Loan Reason
For 2018, Cape Cod Co-operative Bank's most frequently cited loan purpose was Home Purchase, with 205 originations. The 2nd most popular reason was Cash Out Refi, with 108 originations.
Loan Duration/Length
For 2018, Cape Cod Co-operative Bank's most frequently cited loan duration was 30 Year, with 278 originations. The 2nd most popular length was 20 Year, with 68 originations.
Origination Fees/Closing Costs
Cape Cod Co-operative Bank's average total fees were $3,156, while their most frequently occuring range of origination fees (closing costs) were in the $<1k bucket, with 373 originations.
Interest Rates
| Loan Rate | Originations | Total Value | Average Loan |
|---|---|---|---|
| 4-5% | 219 | $52,645,000 | $240,388 |
| 3-4% | 184 | $63,010,000 | $342,446 |
| 5-6% | 29 | $11,545,000 | $398,103 |
| 6-7% | 6 | $3,550,000 | $591,667 |
During 2018, Cape Cod Co-operative Bank's average interest rate for loans was 4.23%, while their most frequently originated rate bucket for loans was 4-5%, with 219 originations.
Loan Sizing
2018 saw Cape Cod Co-operative Bank place emphasis on $200k-400k loans with 200 originations, totaling $57,640,000 in origination value.
Applicant Income
Cape Cod Co-operative Bank lent most frequently to those with incomes in the $100k-150k range, with 95 originations. The second most popular income band? $150k-250k, with 91 originations.
Applicant Debt to Income Ratio
Cape Cod Co-operative Bank lent most frequently to those with DTI ratios of 30-36%, with 96 originations. The next most common DTI ratio? 20-30%, with 82 originations.
Ethnicity Mix
Approval Rates
Total approvals of all applications92.30%
Cape Cod Co-operative Bank has an average approval rate.
Pick Rate
Approvals leading to origination81.28%
Cape Cod Co-operative Bank has a below average pick rate.
Points and Fees
| Points | Originations | Total Value | Average Loan |
|---|---|---|---|
| NA | 438 | $130,750,000 | $298,516 |
Occupancy Type Mix
| Dwelling Type | Originations | Total Value | Average Loan |
|---|---|---|---|
| Multifamily:Site-Built | 11 | $8,865,000 | $805,909 |
| Single Family (1-4 Units):Site-Built | 427 | $121,885,000 | $285,445 |
LTV Distribution
Bank Details
Branches
| Bank Name | Branch | Branch Type | Deposits (000's) |
|---|---|---|---|
| Cape Cod Co-operative Bank | 1121 Route 6a West Barnstable, MA 2668 | Full Service B&M | $67,041 |
| Cape Cod Co-operative Bank | 121 Main Street Yarmouth Port, MA 2675 | Full Service B&M | $179,082 |
| Cape Cod Co-operative Bank | 121 Main Street/Route 6a Yarmouth Port, MA 2675 | Limited, Mobile/Seasonal Office | $2,890 |
| Cape Cod Co-operative Bank | 1470 Orleans Road East Harwich, MA 2645 | Full Service B&M | $52,516 |
| Cape Cod Co-operative Bank | 1591 Main Street East Dennis, MA 2641 | Full Service B&M | $156,633 |
| Cape Cod Co-operative Bank | 237 North Main Street South Yarmouth, MA 2664 | Limited, Mobile/Seasonal Office | $755 |
| Cape Cod Co-operative Bank | 238 Worcester Court Falmouth, MA 2540 | Full Service B&M | $21,675 |
| Cape Cod Co-operative Bank | 275 Cotuit Road Sandwich, MA 2563 | Full Service B&M | $90,127 |
| Cape Cod Co-operative Bank | 3878 Falmouth Road Marstons Mills, MA 2648 | Full Service B&M | $23,111 |
| Cape Cod Co-operative Bank | 64 King's Circuit Yarmouth Port, MA 2675 | Full Service B&M | $12,911 |
| Cape Cod Co-operative Bank | 660 N Falmouth Hwy North Falmouth, MA 2556 | Full Service B&M | $26,358 |
| Cape Cod Co-operative Bank | 695 Attucks Lane Hyannis Hyannis, MA 2601 | Full Service B&M | $177,017 |
For 2018, Cape Cod Co-operative Bank had 12 branches.
Yearly Performance Overview
Bank Income
| Item | Value (in 000's) |
|---|---|
| Total interest income | $35,184 |
| Net interest income | $29,686 |
| Total noninterest income | $4,348 |
| Gross Fiduciary activities income | $0 |
| Service charges on deposit accounts | $480 |
| Trading account gains and fees | $0 |
| Additional Noninterest Income | $3,868 |
| Pre-tax net operating income | $7,748 |
| Securities gains (or losses, -) | $1,205 |
| Income before extraordinary items | $6,815 |
| Discontinued Operations (Extraordinary gains, net) | $0 |
| Net income of bank and minority interests | $6,815 |
| Minority interest net income | $0 |
| Net income | $6,815 |
| Sale, conversion, retirement of capital stock, net | $0 |
| Net operating income | $5,863 |
Cape Cod Co-operative Bank's gross interest income from loans was $35,184,000.
Cape Cod Co-operative Bank's net interest income from loans was $29,686,000.
Cape Cod Co-operative Bank's fee based income from loans was $480,000.
Cape Cod Co-operative Bank's net income from loans was $6,815,000.
Bank Expenses
| Item | Value (in 000's) |
|---|---|
| Total interest expense | $5,498 |
| Provision for credit losses | $0 |
| Total noninterest expense | $26,286 |
| Salaries and employee benefits | $14,685 |
| Premises and equipment expense | $3,102 |
| Additional noninterest expense | $8,499 |
| Applicable income taxes | $2,138 |
| Net charge-offs | $0 |
| Cash dividends | $0 |
Cape Cod Co-operative Bank's interest expense for loans was $5,498,000.
Cape Cod Co-operative Bank's payroll and benefits expense were $14,685,000.
Cape Cod Co-operative Bank's property, plant and equipment expenses $3,102,000.
Loan Performance
| Type of Loan | % of Loans Noncurrent (30+ days, end of period snapshot) |
|---|---|
| All loans | 1.0% |
| Real Estate loans | 1.0% |
| Construction & Land Development loans | 0.0% |
| Nonfarm, nonresidential loans | 0.0% |
| Multifamily residential loans | 7.0% |
| 1-4 family residential loans | 1.0% |
| HELOC loans | 2.0% |
| All other family | 1.0% |
| Commercial & industrial loans | 1.0% |
| Personal loans | 0.0% |
| Credit card loans | 0.0% |
| Other individual loans | 0.0% |
| Auto loans | 0.0% |
| Other consumer loans | 0.0% |
| Unsecured commercial real estate loans | 0.0% |
Deposits
| Type | Value (in 000's) |
|---|---|
| Total deposits | $793,441 |
| Deposits held in domestic offices | $793,441 |
| Deposits by Individuals, partnerships, and corporations | $726,409 |
| Deposits by U.S. Government | $0 |
| Deposits by States and political subdivisions in the U.S. | $67,032 |
| Deposits by Commercial banks and other depository institutions in U.S. | $0 |
| Deposits by Banks in foreign countries | $0 |
| Deposits by Foreign governments and official institutions | $0 |
| Transaction accounts | $85,430 |
| Demand deposits | $58,291 |
| Nontransaction accounts | $708,011 |
| Money market deposit accounts (MMDAs) | $300,924 |
| Other savings deposits (excluding MMDAs) | $293,063 |
| Total time deposits | $114,025 |
| Total time and savings deposits | $735,150 |
| Noninterest-bearing deposits | $58,291 |
| Interest-bearing deposits | $735,150 |
| Retail deposits | $746,930 |
| IRAs and Keogh plan accounts | $14,268 |
| Brokered deposits | $0 |
| Deposits held in foreign offices | $0 |
Assets
| Asset | Value (in 000's) |
|---|---|
| Total Assets | $931,608 |
| Cash & Balances due from depository institutions | $17,718 |
| Interest-bearing balances | $6,978 |
| Total securities | $57,609 |
| Federal funds sold & reverse repurchase | $10 |
| Net loans and leases | $807,131 |
| Loan and leases loss allowance | $7,590 |
| Trading account assets | $281 |
| Bank premises and fixed assets | $18,950 |
| Other real estate owned | $39 |
| Goodwill and other intangibles | $1,945 |
| All other assets | $27,925 |
Liabilities
| Liabilities | Value (in 000's) |
|---|---|
| Total liabilities and capital | $931,608 |
| Total Liabilities | $840,631 |
| Total deposits | $793,441 |
| Interest-bearing deposits | $735,150 |
| Deposits held in domestic offices | $793,441 |
| % insured (estimated) | $73 |
| Federal funds purchased and repurchase agreements | $3,172 |
| Trading liabilities | $281 |
| Other borrowed funds | $40,956 |
| Subordinated debt | $0 |
| All other liabilities | $2,781 |
Issued Loan Types
| Type | Value (in 000's) |
|---|---|
| Net loans and leases | $807,131 |
| Loan and leases loss allowance | $7,590 |
| Total loans and leases (domestic) | $814,721 |
| All real estate loans | $781,830 |
| Real estate loans in domestic offices | $781,830 |
| Construction and development loans | $49,968 |
| Residential 1-4 family construction | $30,829 |
| Other construction, all land development and other land | $19,139 |
| Loans secured by nonfarm nonresidential properties | $176,418 |
| Nonfarm nonresidential secured by owner-occupied properties | $68,777 |
| Commercial real estate & other non-farm, non-residential | $107,641 |
| Multifamily residential real estate | $11,324 |
| 1-4 family residential loans | $544,120 |
| Farmland loans | $0 |
| Loans held in foreign offices | $0 |
| Farm loans | $0 |
| Commercial and industrial loans | $32,162 |
| To non-U.S. addressees | $0 |
| Loans to individuals | $729 |
| Credit card loans | $0 |
| Related Plans | $275 |
| Consumer Auto Loans | $2 |
| Other loans to individuals | $452 |
| All other loans & leases | $0 |
| Loans to foreign governments and official institutions | $0 |
| Other loans | $0 |
| Loans to depository institutions and acceptances of other banks | $0 |
| Loans not secured by real estate | $0 |
| Loans secured by real estate to non-U.S. addressees | $0 |
| Restructured Loans & leases | $5,928 |
| Non 1-4 family restructured loans & leases | $202 |
| Total loans and leases (foreign) | $0 |
Cape Cod Co-operative Bank had $807,131,000 of loans outstanding in 2018. $781,830,000 of loans were in real estate loans. $49,968,000 of loans were in development loans. $11,324,000 of loans were in multifamily mortgage loans. $544,120,000 of loans were in 1-4 family mortgage loans. $0 of loans were in farm loans. $0 of loans were in credit card loans. $2,000 of loans were in the auto loan category.
Small Business Loans
| Categorization | # of Loans in Category | $ amount of loans (in 000's) | Average $/loan |
|---|---|---|---|
| Nonfarm, nonresidential loans - <$1MM | 253 | $65,626 | $259,391 |
| Nonfarm, nonresidential loans - <$100k | 36 | $1,914 | $53,167 |
| Nonfarm, nonresidential loans - $100-250k | 79 | $10,737 | $135,911 |
| Nonfarm, nonresidential loans - $250k-1MM | 138 | $52,975 | $383,877 |
| Commercial & Industrial, US addressed loans - <$1MM | 253 | $21,934 | $86,696 |
| Commercial & Industrial, US addressed loans - <$100k | 157 | $3,302 | $21,032 |
| Commercial & Industrial, US addressed loans - $100-250k | 47 | $3,579 | $76,149 |
| Commercial & Industrial, US addressed loans - $250k-1MM | 49 | $15,053 | $307,204 |