Pinnacle Lending Group Mortgage Rates, Fees & Info
LAS VEGAS, NVLEI: 5493005T6ET3508ZXP66
Tax ID: 20-4095036
Latest/2024 | 2023 Data | 2022 Data | 2021 Data | 2020 Data | 2019 Data | 2018 Data
Jump to:
Mortgage Data
Review & Overview
Pinnacle Lending Group is a smaller mortgage company specializing in Refi and Home Purchase loans. Pinnacle Lending Group has a high proportion of conventional loans. They have an average proportion of FHA loans. Their top markets by origination volume include: Las Vegas, Phoenix, Pahrump, Los Angeles, and Reno among others. We have data for 13 markets. (Some data included below & more in-depth data is available with an active subscription.)Pinnacle Lending Group has an above average approval rate when compared to the average across all lenders. They have a below average pick rate when compared to similar lenders. Pinnacle Lending Group is typically a low fee lender. (We use the term "fees" to include things like closing costs and other costs incurred by borrowers-- whether they are paid out of pocket or rolled into the loan.) They typically have about average rates.
We show data for every lender and do not change our ratings-- even if an organization is a paid advertiser. Our consensus data does have lag, but it is highly correlated to a lender's rates & fees relative to their markets. This means that if a bank is a low fee/rate lender the past-- chances are they are still one today. Our SimulatedRates™ use advanced statistical techniques to forecast different rates based on a lender's historical data.
Mortgage seekers: Choose your metro area here to explore the lowest fee & rate lenders.
Mortgage professionals: We have various tools to make your lives easier. Contact us to see how we can help with your market research, analytics or advertising needs.
Originations
940Origination Dollar Volume (All Markets)
$265,760,000Awards


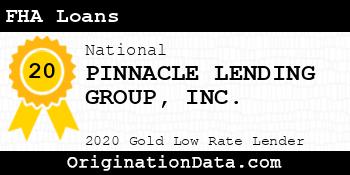
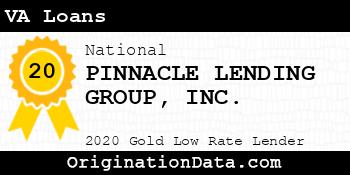
PINNACLE LENDING GROUP - 2020
PINNACLE LENDING GROUP is a 2020 , due to their low .
For 2020, less than of lenders were eligible for this award.
Work for PINNACLE LENDING GROUP?
Use this award on your own site. Either save and use the images below, or pass the provided image embed code to your development team.
Top Markets
Zoom/scroll map to see bank's per metro statistics. Subscribers can configure state/metro/county granularity, assorted fields and quantity of results. This map shows top 10 markets in the map viewport, as defined by descending origination volume.
| Market | Originations | Total Value | Average Loan | Average Fees | Average Rate |
|---|---|---|---|---|---|
| LAS VEGAS-HENDERSON-PARADISE, NV (FHA|USDA|VA) | 857 | $241,565,000 | $281,873 | $4,944 | 3.04% |
| PHOENIX-MESA-CHANDLER, AZ (FHA|USDA|VA) | 41 | $11,975,000 | $292,073 | $5,543 | 3.04% |
| Pahrump, NV (FHA|USDA|VA) | 10 | $1,840,000 | $184,000 | $4,595 | 2.79% |
| Los Angeles-Long Beach-Anaheim, CA (FHA|USDA|VA) | 4 | $1,750,000 | $437,500 | $4,500 | 3.06% |
| RENO, NV (FHA|USDA|VA) | 5 | $1,735,000 | $347,000 | $4,221 | 2.65% |
| SAN DIEGO-CHULA VISTA-CARLSBAD, CA (FHA|USDA|VA) | 6 | $1,710,000 | $285,000 | $4,426 | 3.40% |
| TUCSON, AZ (FHA|USDA|VA) | 4 | $1,480,000 | $370,000 | $4,772 | 2.47% |
| Fernley, NV (FHA|USDA|VA) | 4 | $920,000 | $230,000 | $6,357 | 2.97% |
| RIVERSIDE-SAN BERNARDINO-ONTARIO, CA (FHA|USDA|VA) | 2 | $780,000 | $390,000 | $6,658 | 2.62% |
| Gardnerville Ranchos, NV (FHA|USDA|VA) | 2 | $780,000 | $390,000 | $3,571 | 3.00% |
| SACRAMENTO-ROSEVILLE-FOLSOM, CA (FHA|USDA|VA) | 2 | $740,000 | $370,000 | $13,325 | 3.13% |
| Nogales, AZ (FHA|USDA|VA) | 2 | $260,000 | $130,000 | $6,706 | 3.06% |
| PRESCOTT VALLEY-PRESCOTT, AZ (FHA|USDA|VA) | 1 | $225,000 | $225,000 | $3,340 | 2.75% |
Similar Lenders
We use machine learning to identify the top lenders compared against PINNACLE LENDING GROUP based on their rates and fees, along with other useful metrics. A lower similarity rank signals a stronger match.
Similarity Rank: 825
Similarity Rank: 1034
Similarity Rank: 1054
Similarity Rank: 1056
Similarity Rank: 1056
Similarity Rank: 1218
Similarity Rank: 1290
Similarity Rank: 1998
Similarity Rank: 2178
Similarity Rank: 2387
Product Mix
| Loan Type | Originations | Total Value | Avg. Loan | Avg. Fees | Avg. Rate |
|---|---|---|---|---|---|
| Conventional | 689 | $189,475,000 | $275,000 | $4,018 | 3.12% |
| FHA | 130 | $34,440,000 | $264,923 | $7,647 | 2.87% |
| VA | 121 | $41,845,000 | $345,826 | $7,587 | 2.68% |
For 2020, Pinnacle Lending Group's most frequently originated type of loan was Conventional, with 689 originations. Their 2nd most popular type was FHA, with 130 originations.
Loan Reason
For 2020, Pinnacle Lending Group's most frequently cited loan purpose was Refi, with 447 originations. The 2nd most popular reason was Home Purchase, with 340 originations.
Loan Duration/Length
For 2020, Pinnacle Lending Group's most frequently cited loan duration was 30 Year, with 861 originations. The 2nd most popular length was 15 Year, with 51 originations.
Origination Fees/Closing Costs
| Origination Fee/Closing Cost | Originations | Total Value | Average Loan |
|---|---|---|---|
| $1k-2k | 934 | $264,230,000 | $282,901 |
| $<1k | 3 | $725,000 | $241,667 |
| $5k+ | 2 | $510,000 | $255,000 |
Pinnacle Lending Group's average total fees were $5,071, while their most frequently occuring range of origination fees (closing costs) were in the $1k-2k bucket, with 934 originations.
Interest Rates
| Loan Rate | Originations | Total Value | Average Loan |
|---|---|---|---|
| 2.5-3% | 376 | $103,130,000 | $274,282 |
| 3-4% | 353 | $99,935,000 | $283,102 |
| <2.5% | 177 | $54,565,000 | $308,277 |
| 4-5% | 33 | $7,925,000 | $240,152 |
| 5-6% | 1 | $205,000 | $205,000 |
During 2020, Pinnacle Lending Group's average interest rate for loans was 3.06%, while their most frequently originated rate bucket for loans was 2.5-3%, with 376 originations.
Loan Sizing
2020 saw Pinnacle Lending Group place emphasis on $200k-400k loans with 610 originations, totaling $173,350,000 in origination value.
Applicant Income
Pinnacle Lending Group lent most frequently to those with incomes in the $50k or less range, with 237 originations. The second most popular income band? $50k-75k, with 220 originations.
Applicant Debt to Income Ratio
Pinnacle Lending Group lent most frequently to those with DTI ratios of 30-36%, with 158 originations. The next most common DTI ratio? 20-30%, with 110 originations.
Ethnicity Mix
Approval Rates
Total approvals of all applications97.86%
Pinnacle Lending Group has an exceptionally high approval rate. They either target their audience very well or may have lax underwriting protocols.
Pick Rate
Approvals leading to origination74.15%
Pinnacle Lending Group has a below average pick rate.
Points and Fees
| Points | Originations | Total Value | Average Loan |
|---|---|---|---|
| 3030.0 | 1 | $355,000 | $355,000 |
| NA | 939 | $265,405,000 | $282,646 |
Occupancy Type Mix
| Dwelling Type | Originations | Total Value | Average Loan |
|---|---|---|---|
| Single Family (1-4 Units):Site-Built | 940 | $265,760,000 | $282,723 |
LTV Distribution
Complaints
| Bank Name | Product | Issue | 2020 CPFB Complaints | % of Total Issues |
|---|---|---|---|---|
| PINNACLE FINANCIAL PARTNERS, INC. | Conventional home mortgage | Applying for a mortgage or refinancing an existing mortgage | 1 | 25.0% |
| PINNACLE FINANCIAL PARTNERS, INC. | Conventional home mortgage | Trouble during payment process | 1 | 25.0% |
| PINNACLE FINANCIAL PARTNERS, INC. | FHA mortgage | Incorrect information on your report | 1 | 25.0% |
| PINNACLE FINANCIAL PARTNERS, INC. | Other type of mortgage | Applying for a mortgage or refinancing an existing mortgage | 1 | 25.0% |