Ccfcu Funding Mortgage Rates, Fees & Info
ALBANY, NYLEI: 549300VG7NKKVNYENV67
Tax ID: 27-1365466
Latest/2024 | 2023 Data | 2022 Data | 2021 Data | 2020 Data | 2019 Data | 2018 Data
Jump to:
Mortgage Data
Review & Overview
Ccfcu Funding is a smaller credit union specializing in Home Purchase loans. Ccfcu Funding has a high proportion of conventional loans. They have a a low proportion of FHA loans. (This may mean they shy away from first time homebuyers.) Their top markets by origination volume include: Albany, Utica, Glens Falls, Poughkeepsie, and Gloversville among others. We have data for 21 markets. (Some data included below & more in-depth data is available with an active subscription.)Ccfcu Funding has an above average approval rate when compared to the average across all lenders. They have an above average pick rate when compared to similar lenders. Ccfcu Funding is typically a low fee lender. (We use the term "fees" to include things like closing costs and other costs incurred by borrowers-- whether they are paid out of pocket or rolled into the loan.) They typically have about average rates.
We show data for every lender and do not change our ratings-- even if an organization is a paid advertiser. Our consensus data does have lag, but it is highly correlated to a lender's rates & fees relative to their markets. This means that if a bank is a low fee/rate lender the past-- chances are they are still one today. Our SimulatedRates™ use advanced statistical techniques to forecast different rates based on a lender's historical data.
Mortgage seekers: Choose your metro area here to explore the lowest fee & rate lenders.
Mortgage professionals: We have various tools to make your lives easier. Contact us to see how we can help with your market research, analytics or advertising needs.
Originations
1,569Origination Dollar Volume (All Markets)
$401,805,000Awards
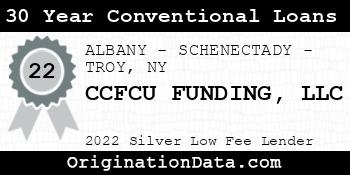
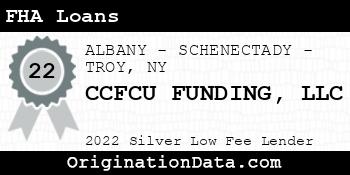
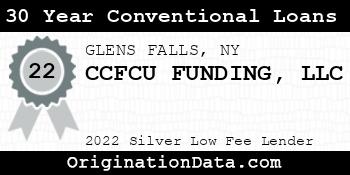

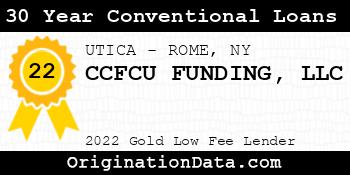
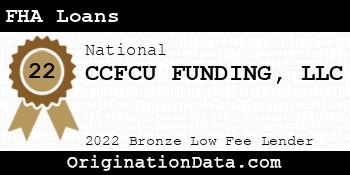
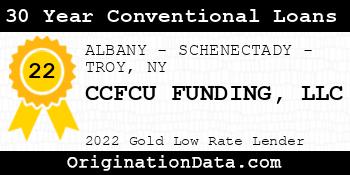
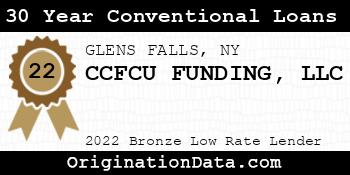
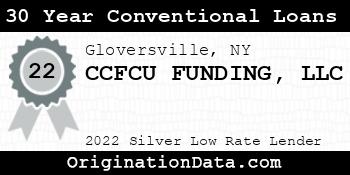
CCFCU FUNDING - 2022
CCFCU FUNDING is a 2022 , due to their low .
For 2022, less than of lenders were eligible for this award.
Work for CCFCU FUNDING?
Use this award on your own site. Either save and use the images below, or pass the provided image embed code to your development team.
Top Markets
Zoom/scroll map to see bank's per metro statistics. Subscribers can configure state/metro/county granularity, assorted fields and quantity of results. This map shows top 10 markets in the map viewport, as defined by descending origination volume.
| Market | Originations | Total Value | Average Loan | Average Fees | Average Rate |
|---|---|---|---|---|---|
| ALBANY-SCHENECTADY-TROY, NY (FHA|USDA|VA) | 1,259 | $338,445,000 | $268,820 | $3,906 | 3.90% |
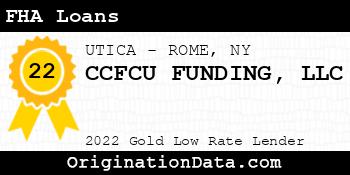
| UTICA-ROME, NY (FHA|USDA|VA) | 133 | $20,075,000 | $150,940 | $4,189 | 4.31% |
| GLENS FALLS, NY (FHA|USDA|VA) | 28 | $7,340,000 | $262,143 | $3,911 | 4.12% |
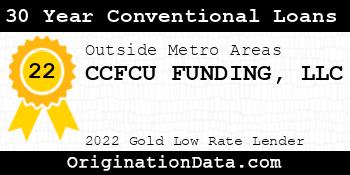
| Outside of Metro Areas | 33 | $6,185,000 | $187,424 | $4,276 | 3.94% |
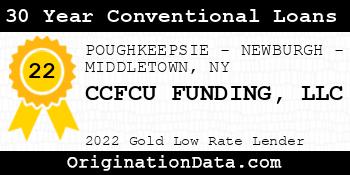
| POUGHKEEPSIE-NEWBURGH-MIDDLETOWN, NY (FHA|USDA|VA) | 16 | $5,370,000 | $335,625 | $4,197 | 3.83% |
| Gloversville, NY (FHA|USDA|VA) | 19 | $4,215,000 | $221,842 | $3,765 | 4.29% |
| New York-Newark-Jersey City, NY-NJ-PA (FHA|USDA|VA) | 11 | $3,885,000 | $353,182 | $4,250 | 3.98% |
| Hudson, NY (FHA|USDA|VA) | 9 | $3,475,000 | $386,111 | $4,376 | 3.96% |
| Amsterdam, NY (FHA|USDA|VA) | 13 | $2,655,000 | $204,231 | $3,928 | 4.52% |
| SYRACUSE, NY (FHA|USDA|VA) | 12 | $2,240,000 | $186,667 | $3,756 | 5.06% |
| KINGSTON, NY (FHA|USDA|VA) | 7 | $1,975,000 | $282,143 | $5,601 | 3.73% |
| Oneonta, NY (FHA|USDA|VA) | 9 | $1,915,000 | $212,778 | $4,347 | 4.85% |
| BUFFALO-CHEEKTOWAGA, NY (FHA|USDA|VA) | 3 | $1,145,000 | $381,667 | $3,836 | 4.21% |
| BINGHAMTON, NY (FHA|USDA|VA) | 6 | $960,000 | $160,000 | $5,297 | 4.85% |
| ITHACA, NY (FHA|USDA|VA) | 1 | $415,000 | $415,000 | $4,262 | 2.75% |
| Plattsburgh, NY (FHA|USDA|VA) | 3 | $415,000 | $138,333 | $3,518 | 3.17% |
| Seneca Falls, NY (FHA|USDA|VA) | 1 | $305,000 | $305,000 | $4,722 | 5.38% |
| Malone, NY (FHA|USDA|VA) | 2 | $250,000 | $125,000 | $3,944 | 4.38% |
| Ogdensburg-Massena, NY (FHA|USDA|VA) | 1 | $205,000 | $205,000 | $2,905 | 2.75% |
| Olean, NY (FHA|USDA|VA) | 2 | $180,000 | $90,000 | $4,013 | 3.25% |
| Corning, NY (FHA|USDA|VA) | 1 | $155,000 | $155,000 | $3,549 | 4.00% |
Similar Lenders
We use machine learning to identify the top lenders compared against CCFCU FUNDING based on their rates and fees, along with other useful metrics. A lower similarity rank signals a stronger match.
Similarity Rank: 22
Similarity Rank: 24
Similarity Rank: 30
Similarity Rank: 51
Similarity Rank: 72
Similarity Rank: 91
Similarity Rank: 124
Similarity Rank: 142
Similarity Rank: 143
Similarity Rank: 144
Product Mix
| Loan Type | Originations | Total Value | Avg. Loan | Avg. Fees | Avg. Rate |
|---|---|---|---|---|---|
| Conventional | 1,499 | $389,665,000 | $259,950 | $3,797 | 3.95% |
| FHA | 70 | $12,140,000 | $173,429 | $7,272 | 4.33% |
For 2022, Ccfcu Funding's most frequently originated type of loan was Conventional, with 1,499 originations. Their 2nd most popular type was FHA, with 70 originations.
Loan Reason
For 2022, Ccfcu Funding's most frequently cited loan purpose was Home Purchase, with 1,127 originations. The 2nd most popular reason was Cash Out Refi, with 223 originations.
Loan Duration/Length
For 2022, Ccfcu Funding's most frequently cited loan duration was 30 Year, with 1,377 originations. The 2nd most popular length was 15 Year, with 136 originations.
Origination Fees/Closing Costs
Ccfcu Funding's average total fees were $4,069, while their most frequently occuring range of origination fees (closing costs) were in the $<1k bucket, with 854 originations.
Interest Rates
During 2022, Ccfcu Funding's average interest rate for loans was 4.06%, while their most frequently originated rate bucket for loans was 3-4%, with 690 originations.
Loan Sizing
2022 saw Ccfcu Funding place emphasis on $200k-400k loans with 751 originations, totaling $209,535,000 in origination value.
Applicant Income
Ccfcu Funding lent most frequently to those with incomes in the $100k-150k range, with 442 originations. The second most popular income band? $50k-75k, with 370 originations.
Applicant Debt to Income Ratio
Ccfcu Funding lent most frequently to those with DTI ratios of 30-36%, with 327 originations. The next most common DTI ratio? 20-30%, with 295 originations.
Ethnicity Mix
Approval Rates
Total approvals of all applications97.28%
Ccfcu Funding has an exceptionally high approval rate. They either target their audience very well or may have lax underwriting protocols.
Pick Rate
Approvals leading to origination91.08%
Ccfcu Funding has an average pick rate.
Points and Fees
| Points | Originations | Total Value | Average Loan |
|---|---|---|---|
| NA | 1,569 | $401,805,000 | $256,090 |