Isabella Bank Mortgage Rates, Fees & Info
Mount Pleasant, MILEI: 549300XYX207IABFXL60
Tax ID: 38-0681630
Latest/2024 | 2023 Data | 2022 Data | 2021 Data | 2020 Data | 2019 Data | 2018 Data
Jump to:
Mortgage Data
Bank Data
Review & Overview
Isabella Bank is a smaller bank specializing in Refi and Home Purchase loans. Isabella Bank has a high proportion of conventional loans. They have a low ratio of USDA loans. Their top markets by origination volume include: Mount Pleasant, Big Rapids, Grand Rapids, Saginaw, and Midland among others. We have data for 28 markets. (Some data included below & more in-depth data is available with an active subscription.)Isabella Bank has an average approval rate when compared to the average across all lenders. They have a below average pick rate when compared to similar lenders. Isabella Bank is typically a low fee lender. (We use the term "fees" to include things like closing costs and other costs incurred by borrowers-- whether they are paid out of pocket or rolled into the loan.) They typically have about average rates.
We show data for every lender and do not change our ratings-- even if an organization is a paid advertiser. Our consensus data does have lag, but it is highly correlated to a lender's rates & fees relative to their markets. This means that if a bank is a low fee/rate lender the past-- chances are they are still one today. Our SimulatedRates™ use advanced statistical techniques to forecast different rates based on a lender's historical data.
Mortgage seekers: Choose your metro area here to explore the lowest fee & rate lenders.
Mortgage professionals: We have various tools to make your lives easier. Contact us to see how we can help with your market research, analytics or advertising needs.
SimulatedRates™Mortgage Type |
Simulated Rate | Simulation Date |
|---|---|---|
| 30 Year Conventional Purchase | 6.57% | 7/17/26 |
| 30 Year Conventional Refi | 6.23% | 7/17/26 |
| 30 Year Cash-out Refi | 6.94% | 7/17/26 |
| 30 Year USDA Purchase | 7.07% | 7/17/26 |
| 15 Year Conventional Purchase | 6.07% | 7/17/26 |
| 15 Year Conventional Refi | 6.19% | 7/17/26 |
| 15 Year Cash-out Refi | 6.19% | 7/17/26 |
| These are simulated rates generated by our proprietary machine learning models. These are not guaranteed by the bank. They are our estimates based on a lender's past behaviors combined with current market conditions. Contact an individual lender for their actual rates. Our models use fixed rate terms for conforming loans, 700+ FICO, 10% down for FHA and 20% for conventional. These are based on consensus, historical data-- not advertised promotional rates. | ||
Isabella Bank Mortgage Calculator
Your Estimates
Estimated Loan Payment: Update the calculator values and click calculate payment!
This is not an official calculator from Isabella Bank. It uses our SimulatedRate™
technology, basic math and reasonable assumptions to calculate mortgage payments derived from our simulations and your inputs.
The default purchase price is the median sales price across the US for 2022Q4, per FRED.
Originations
1,354Origination Dollar Volume (All Markets)
$252,490,000Employee count
340Awards


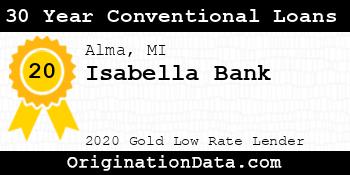
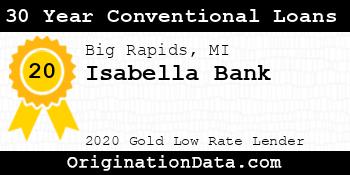

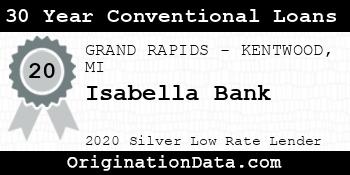
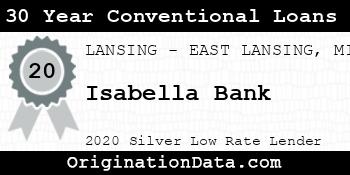


Isabella Bank - 2020
Isabella Bank is a 2020 , due to their low .
For 2020, less than of lenders were eligible for this award.
Work for Isabella Bank?
Use this award on your own site. Either save and use the images below, or pass the provided image embed code to your development team.
Top Markets
Zoom/scroll map to see bank's per metro statistics. Subscribers can configure state/metro/county granularity, assorted fields and quantity of results. This map shows top 10 markets in the map viewport, as defined by descending origination volume.
| Market | Originations | Total Value | Average Loan | Average Fees | Average Rate |
|---|---|---|---|---|---|
| Mount Pleasant, MI (FHA|USDA|VA) | 416 | $63,030,000 | $151,514 | $2,371 | 3.10% |
| Big Rapids, MI (FHA|USDA|VA) | 182 | $38,120,000 | $209,451 | $2,291 | 3.05% |
| GRAND RAPIDS-KENTWOOD, MI (FHA|USDA|VA) | 160 | $27,430,000 | $171,438 | $2,480 | 3.14% |
| Outside of Metro Areas | 151 | $25,825,000 | $171,026 | $2,246 | 3.14% |
| SAGINAW, MI (FHA|USDA|VA) | 88 | $22,390,000 | $254,432 | $2,031 | 3.29% |
| MIDLAND, MI (FHA|USDA|VA) | 96 | $19,990,000 | $208,229 | $2,269 | 3.35% |
| Detroit-Warren-Dearborn, MI (FHA|USDA|VA) | 89 | $18,775,000 | $210,955 | $2,276 | 2.77% |
| BAY CITY, MI (FHA|USDA|VA) | 22 | $8,940,000 | $406,364 | $2,315 | 3.59% |
| Alma, MI (FHA|USDA|VA) | 58 | $7,810,000 | $134,655 | $2,252 | 3.36% |
| LANSING-EAST LANSING, MI (FHA|USDA|VA) | 24 | $5,870,000 | $244,583 | $2,767 | 2.96% |
| Traverse City, MI (FHA|USDA|VA) | 13 | $4,165,000 | $320,385 | $3,743 | 2.90% |
| ANN ARBOR, MI (FHA|USDA|VA) | 10 | $2,250,000 | $225,000 | $1,727 | 2.61% |
| Holland, MI (FHA|USDA|VA) | 5 | $1,045,000 | $209,000 | $2,674 | 2.83% |
| FLINT, MI (FHA|USDA|VA) | 7 | $945,000 | $135,000 | $2,048 | 3.75% |
| MUSKEGON, MI (FHA|USDA|VA) | 4 | $760,000 | $190,000 | $1,914 | 2.88% |
| Cadillac, MI (FHA|USDA|VA) | 4 | $700,000 | $175,000 | $2,378 | 2.91% |
| Ludington, MI (FHA|USDA|VA) | 5 | $665,000 | $133,000 | $2,612 | 3.43% |
| NILES, MI (FHA|USDA|VA) | 2 | $640,000 | $320,000 | $2,405 | 2.81% |
| KALAMAZOO-PORTAGE, MI (FHA|USDA|VA) | 3 | $635,000 | $211,667 | $2,964 | 2.75% |
| Sturgis, MI (FHA|USDA|VA) | 2 | $550,000 | $275,000 | $3,163 | 2.81% |
| Adrian, MI (FHA|USDA|VA) | 3 | $535,000 | $178,333 | $2,892 | 2.83% |
| JACKSON, MI (FHA|USDA|VA) | 2 | $330,000 | $165,000 | $2,757 | 3.00% |
| Houghton, MI (FHA|USDA|VA) | 2 | $320,000 | $160,000 | $2,427 | 2.75% |
| MONROE, MI (FHA|USDA|VA) | 2 | $240,000 | $120,000 | $1,911 | 2.63% |
| Hillsdale, MI (FHA|USDA|VA) | 1 | $165,000 | $165,000 | $2,474 | 3.00% |
| Sault Ste. Marie, MI (FHA|USDA|VA) | 1 | $155,000 | $155,000 | $4,231 | 3.00% |
| Iron Mountain, MI-WI (FHA|USDA|VA) | 1 | $105,000 | $105,000 | $2,818 | 3.00% |
| Alpena, MI (FHA|USDA|VA) | 1 | $105,000 | $105,000 | $1,853 | 2.75% |
Similar Lenders
We use machine learning to identify the top lenders compared against Isabella Bank based on their rates and fees, along with other useful metrics. A lower similarity rank signals a stronger match.
Similarity Rank: 54
Similarity Rank: 154
Similarity Rank: 210
Similarity Rank: 235
Similarity Rank: 287
Similarity Rank: 387
Similarity Rank: 408
Similarity Rank: 425
Similarity Rank: 434
Similarity Rank: 472
Product Mix
| Loan Type | Originations | Total Value | Avg. Loan | Avg. Fees | Avg. Rate |
|---|---|---|---|---|---|
| Conventional | 1,335 | $250,105,000 | $187,345 | $2,324 | 3.11% |
| USDA | 19 | $2,385,000 | $125,526 | $3,494 | 3.47% |
For 2020, Isabella Bank's most frequently originated type of loan was Conventional, with 1,335 originations. Their 2nd most popular type was USDA, with 19 originations.
Loan Reason
For 2020, Isabella Bank's most frequently cited loan purpose was Refi, with 651 originations. The 2nd most popular reason was Home Purchase, with 421 originations.
Loan Duration/Length
For 2020, Isabella Bank's most frequently cited loan duration was 30 Year, with 624 originations. The 2nd most popular length was 15 Year, with 467 originations.
Origination Fees/Closing Costs
Isabella Bank's average total fees were $2,592, while their most frequently occuring range of origination fees (closing costs) were in the $<1k bucket, with 852 originations.
Interest Rates
During 2020, Isabella Bank's average interest rate for loans was 3.12%, while their most frequently originated rate bucket for loans was 2.5-3%, with 551 originations.
Loan Sizing
2020 saw Isabella Bank place emphasis on $100k-200k loans with 622 originations, totaling $89,610,000 in origination value.
Applicant Income
Isabella Bank lent most frequently to those with incomes in the $100k-150k range, with 273 originations. The second most popular income band? $50k-75k, with 260 originations.
Applicant Debt to Income Ratio
Isabella Bank lent most frequently to those with DTI ratios of 20-30%, with 422 originations. The next most common DTI ratio? 30-36%, with 255 originations.
Ethnicity Mix
Approval Rates
Total approvals of all applications87.69%
Isabella Bank has an average approval rate.
Pick Rate
Approvals leading to origination66.54%
Isabella Bank has a low pick rate. They may have issues with closing loans or may approve everyone, but with onerous loan terms.
Points and Fees
| Points | Originations | Total Value | Average Loan |
|---|---|---|---|
| NA | 1,354 | $252,490,000 | $186,477 |
Occupancy Type Mix
LTV Distribution
Bank Details
Branches
| Bank Name | Branch | Branch Type | Deposits (000's) |
|---|---|---|---|
| Isabella Bank | 1125 North Mcewan Street Clare, MI 48617 | Limited, Drive-thru | $0 |
| Isabella Bank | 125 N. Coldwater Rd Lake Isabella, MI 48893 | Full Service B&M | $6,751 |
| Isabella Bank | 131 N State St Stanton, MI 48888 | Full Service B&M | $22,628 |
| Isabella Bank | 1402 East Center Ithaca, MI 48847 | Full Service B&M | $49,599 |
| Isabella Bank | 1402 West High Street Mount Pleasant, MI 48858 | Full Service B&M | $90,990 |
| Isabella Bank | 1405 West Washington Street Greenville, MI 48838 | Full Service B&M | $94,771 |
| Isabella Bank | 1416 East Pickard Street Mount Pleasant, MI 48858 | Full Service B&M | $146,980 |
| Isabella Bank | 16490 Gratiot Road Hemlock, MI 48626 | Full Service B&M | $37,194 |
| Isabella Bank | 1876 North Winn Road Weidman, MI 48893 | Full Service B&M | $24,761 |
| Isabella Bank | 200 East Broadway Mount Pleasant, MI 48858 | Full Service B&M | $203,644 |
| Isabella Bank | 200 S University Mount Pleasant, MI 48858 | Limited, Drive-thru | $0 |
| Isabella Bank | 203 East Genesee Avenue Saginaw, MI 48607 | Full Service B&M | $1,886 |
| Isabella Bank | 210 S Saginaw Street Midland, MI 48640 | Full Service B&M | $20,684 |
| Isabella Bank | 2127 South Mission Street Mount Pleasant, MI 48858 | Full Service B&M | $111,665 |
| Isabella Bank | 21440 Perry St Big Rapids, MI 49307 | Full Service B&M | $47,732 |
| Isabella Bank | 220 West Wheatland Street Remus, MI 49340 | Full Service B&M | $33,938 |
| Isabella Bank | 2222 N. Saginaw Road Midland, MI 48640 | Full Service B&M | $48,812 |
| Isabella Bank | 240 East Northern Avenue Barryton, MI 49305 | Full Service B&M | $23,618 |
| Isabella Bank | 313 West Bridge Street Six Lakes, MI 48886 | Full Service B&M | $37,708 |
| Isabella Bank | 316 East Saginaw Street Breckenridge, MI 48615 | Full Service B&M | $73,235 |
| Isabella Bank | 3388 North Woodruff Road Weidman, MI 48893 | Full Service B&M | $43,831 |
| Isabella Bank | 399 South Main Street Freeland, MI 48623 | Full Service B&M | $23,921 |
| Isabella Bank | 399 West Main Street Farwell, MI 48622 | Full Service B&M | $53,220 |
| Isabella Bank | 401 East Main Street Blanchard, MI 49310 | Full Service B&M | $22,070 |
| Isabella Bank | 4975 Bay Road Saginaw, MI 48604 | Full Service B&M | $35,202 |
| Isabella Bank | 500 East Wright Avenue Shepherd, MI 48883 | Full Service B&M | $38,241 |
| Isabella Bank | 532 Mcewan Clare, MI 48617 | Full Service B&M | $71,845 |
| Isabella Bank | 711 Maple Street Big Rapids, MI 49307 | Full Service B&M | $3,491 |
| Isabella Bank | 8225 West Ludington Drive Lake, MI 48632 | Full Service B&M | $7,651 |
| Isabella Bank | 8351 100th Avenue Canadian Lakes, MI 49346 | Full Service B&M | $65,111 |
For 2020, Isabella Bank had 30 branches.
Yearly Performance Overview
Bank Income
| Item | Value (in 000's) |
|---|---|
| Total interest income | $64,269 |
| Net interest income | $50,476 |
| Total noninterest income | $14,650 |
| Gross Fiduciary activities income | $2,294 |
| Service charges on deposit accounts | $1,824 |
| Trading account gains and fees | $0 |
| Additional Noninterest Income | $10,532 |
| Pre-tax net operating income | $13,381 |
| Securities gains (or losses, -) | $71 |
| Income before extraordinary items | $12,250 |
| Discontinued Operations (Extraordinary gains, net) | $0 |
| Net income of bank and minority interests | $12,250 |
| Minority interest net income | $0 |
| Net income | $12,250 |
| Sale, conversion, retirement of capital stock, net | $0 |
| Net operating income | $12,185 |
Isabella Bank's gross interest income from loans was $64,269,000.
Isabella Bank's net interest income from loans was $50,476,000.
Isabella Bank's fee based income from loans was $1,824,000.
Isabella Bank's net income from loans was $12,250,000.
Bank Expenses
| Item | Value (in 000's) |
|---|---|
| Total interest expense | $13,793 |
| Provision for credit losses | $1,665 |
| Total noninterest expense | $50,080 |
| Salaries and employee benefits | $23,761 |
| Premises and equipment expense | $8,247 |
| Additional noninterest expense | $18,072 |
| Applicable income taxes | $1,202 |
| Net charge-offs | $-140 |
| Cash dividends | $9,300 |
Isabella Bank's interest expense for loans was $13,793,000.
Isabella Bank's payroll and benefits expense were $23,761,000.
Isabella Bank's property, plant and equipment expenses $8,247,000.
Loan Performance
| Type of Loan | % of Loans Noncurrent (30+ days, end of period snapshot) |
|---|---|
| All loans | 0.0% |
| Real Estate loans | 0.0% |
| Construction & Land Development loans | 0.0% |
| Nonfarm, nonresidential loans | 0.0% |
| Multifamily residential loans | 0.0% |
| 1-4 family residential loans | 0.0% |
| HELOC loans | 0.0% |
| All other family | 0.0% |
| Commercial & industrial loans | 0.0% |
| Personal loans | 0.0% |
| Credit card loans | 0.0% |
| Other individual loans | 0.0% |
| Auto loans | 0.0% |
| Other consumer loans | 0.0% |
| Unsecured commercial real estate loans | 0.0% |
Deposits
| Type | Value (in 000's) |
|---|---|
| Total deposits | $1,569,399 |
| Deposits held in domestic offices | $1,569,399 |
| Deposits by Individuals, partnerships, and corporations | $1,342,723 |
| Deposits by U.S. Government | $0 |
| Deposits by States and political subdivisions in the U.S. | $193,266 |
| Deposits by Commercial banks and other depository institutions in U.S. | $33,410 |
| Deposits by Banks in foreign countries | $0 |
| Deposits by Foreign governments and official institutions | $0 |
| Transaction accounts | $680,920 |
| Demand deposits | $680,920 |
| Nontransaction accounts | $888,479 |
| Money market deposit accounts (MMDAs) | $268,360 |
| Other savings deposits (excluding MMDAs) | $237,139 |
| Total time deposits | $382,980 |
| Total time and savings deposits | $888,479 |
| Noninterest-bearing deposits | $378,475 |
| Interest-bearing deposits | $1,190,924 |
| Retail deposits | $1,448,178 |
| IRAs and Keogh plan accounts | $55,301 |
| Brokered deposits | $14,029 |
| Deposits held in foreign offices | $0 |
Assets
| Asset | Value (in 000's) |
|---|---|
| Total Assets | $1,908,060 |
| Cash & Balances due from depository institutions | $246,641 |
| Interest-bearing balances | $215,345 |
| Total securities | $339,227 |
| Federal funds sold & reverse repurchase | $0 |
| Net loans and leases | $1,231,306 |
| Loan and leases loss allowance | $9,744 |
| Trading account assets | $0 |
| Bank premises and fixed assets | $22,686 |
| Other real estate owned | $390 |
| Goodwill and other intangibles | $7,083 |
| All other assets | $60,727 |
Liabilities
| Liabilities | Value (in 000's) |
|---|---|
| Total liabilities and capital | $1,908,060 |
| Total Liabilities | $1,742,485 |
| Total deposits | $1,569,399 |
| Interest-bearing deposits | $1,190,924 |
| Deposits held in domestic offices | $1,569,399 |
| % insured (estimated) | $71 |
| Federal funds purchased and repurchase agreements | $68,747 |
| Trading liabilities | $0 |
| Other borrowed funds | $90,000 |
| Subordinated debt | $0 |
| All other liabilities | $14,339 |
Issued Loan Types
| Type | Value (in 000's) |
|---|---|
| Net loans and leases | $1,231,306 |
| Loan and leases loss allowance | $9,744 |
| Total loans and leases (domestic) | $1,241,050 |
| All real estate loans | $885,069 |
| Real estate loans in domestic offices | $885,069 |
| Construction and development loans | $22,260 |
| Residential 1-4 family construction | $10,508 |
| Other construction, all land development and other land | $11,752 |
| Loans secured by nonfarm nonresidential properties | $351,146 |
| Nonfarm nonresidential secured by owner-occupied properties | $168,285 |
| Commercial real estate & other non-farm, non-residential | $182,861 |
| Multifamily residential real estate | $84,466 |
| 1-4 family residential loans | $355,762 |
| Farmland loans | $71,435 |
| Loans held in foreign offices | $0 |
| Farm loans | $29,820 |
| Commercial and industrial loans | $187,698 |
| To non-U.S. addressees | $0 |
| Loans to individuals | $73,578 |
| Credit card loans | $0 |
| Related Plans | $311 |
| Consumer Auto Loans | $28,472 |
| Other loans to individuals | $44,795 |
| All other loans & leases | $64,885 |
| Loans to foreign governments and official institutions | $0 |
| Other loans | $63,878 |
| Loans to depository institutions and acceptances of other banks | $0 |
| Loans not secured by real estate | $0 |
| Loans secured by real estate to non-U.S. addressees | $0 |
| Restructured Loans & leases | $22,017 |
| Non 1-4 family restructured loans & leases | $16,532 |
| Total loans and leases (foreign) | $0 |
Isabella Bank had $1,231,306,000 of loans outstanding in 2020. $885,069,000 of loans were in real estate loans. $22,260,000 of loans were in development loans. $84,466,000 of loans were in multifamily mortgage loans. $355,762,000 of loans were in 1-4 family mortgage loans. $29,820,000 of loans were in farm loans. $0 of loans were in credit card loans. $28,472,000 of loans were in the auto loan category.
Small Business Loans
| Categorization | # of Loans in Category | $ amount of loans (in 000's) | Average $/loan |
|---|---|---|---|
| Nonfarm, nonresidential loans - <$1MM | 605 | $122,344 | $202,221 |
| Nonfarm, nonresidential loans - <$100k | 180 | $8,082 | $44,900 |
| Nonfarm, nonresidential loans - $100-250k | 218 | $28,079 | $128,803 |
| Nonfarm, nonresidential loans - $250k-1MM | 207 | $86,183 | $416,343 |
| Commercial & Industrial, US addressed loans - <$1MM | 1,882 | $145,133 | $77,116 |
| Commercial & Industrial, US addressed loans - <$100k | 1,359 | $37,931 | $27,911 |
| Commercial & Industrial, US addressed loans - $100-250k | 334 | $40,008 | $119,784 |
| Commercial & Industrial, US addressed loans - $250k-1MM | 189 | $67,194 | $355,524 |
| Farmland loans - <$1MM | 291 | $37,982 | $130,522 |
| Farmland loans - <$100k | 118 | $5,477 | $46,415 |
| Farmland loans - $100-250k | 111 | $14,509 | $130,712 |
| Farmland loans - $250k-1MM | 62 | $17,996 | $290,258 |
| Agriculture operations loans - <$1MM | 338 | $16,127 | $47,713 |
| Agriculture operations loans - <$100k | 266 | $5,730 | $21,541 |
| Agriculture operations loans - $100-250k | 54 | $5,152 | $95,407 |
| Agriculture operations loans - $250k-1MM | 18 | $5,245 | $291,389 |