Citywide Banks Mortgage Rates, Fees & Info
Denver, COLEI: 549300K2M70MU2D2F940
Tax ID: 20-5716674
Latest/2024 | 2023 Data | 2022 Data | 2021 Data | 2020 Data | 2019 Data | 2018 Data
Jump to:
Mortgage Data
Bank Data
Review & Overview
Citywide Banks is a smaller bank specializing in Home Purchase loans. Citywide Banks has a high proportion of conventional loans. Their top markets by origination volume include: Denver, Glenwood Springs, Boulder, Breckenridge, and Warsaw among others. We have data for 16 markets. (Some data included below & more in-depth data is available with an active subscription.)Citywide Banks has an above average approval rate when compared to the average across all lenders. They have a below average pick rate when compared to similar lenders. Citywide Banks is typically a low fee lender. (We use the term "fees" to include things like closing costs and other costs incurred by borrowers-- whether they are paid out of pocket or rolled into the loan.) They typically have about average rates.
We show data for every lender and do not change our ratings-- even if an organization is a paid advertiser. Our consensus data does have lag, but it is highly correlated to a lender's rates & fees relative to their markets. This means that if a bank is a low fee/rate lender the past-- chances are they are still one today. Our SimulatedRates™ use advanced statistical techniques to forecast different rates based on a lender's historical data.
Mortgage seekers: Choose your metro area here to explore the lowest fee & rate lenders.
Mortgage professionals: We have various tools to make your lives easier. Contact us to see how we can help with your market research, analytics or advertising needs.
Originations
153Origination Dollar Volume (All Markets)
$101,685,000Employee count
234Awards
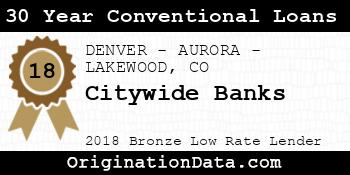
Citywide Banks - 2018
Citywide Banks is a 2018 , due to their low .
For 2018, less than of lenders were eligible for this award.
Work for Citywide Banks?
Use this award on your own site. Either save and use the images below, or pass the provided image embed code to your development team.
Top Markets
Zoom/scroll map to see bank's per metro statistics. Subscribers can configure state/metro/county granularity, assorted fields and quantity of results. This map shows top 10 markets in the map viewport, as defined by descending origination volume.
| Market | Originations | Total Value | Average Loan | Average Fees | Average Rate |
|---|---|---|---|---|---|
| DENVER-AURORA-LAKEWOOD, CO (FHA|USDA|VA) | 91 | $45,165,000 | $496,319 | $3,785 | 5.53% |
| Glenwood Springs, CO (FHA|USDA|VA) | 2 | $24,920,000 | $12,460,000 | $0 | 5.56% |
| BOULDER, CO (FHA|USDA|VA) | 15 | $8,135,000 | $542,333 | $5,208 | 4.67% |
| Breckenridge, CO (FHA|USDA|VA) | 15 | $6,475,000 | $431,667 | $7,180 | 4.97% |
| Warsaw, IN (FHA|USDA|VA) | 1 | $2,635,000 | $2,635,000 | $0 | 5.75% |
| SAN DIEGO-CHULA VISTA-CARLSBAD, CA (FHA|USDA|VA) | 1 | $2,585,000 | $2,585,000 | $0 | 6.00% |
| Edwards, CO (FHA|USDA|VA) | 5 | $2,445,000 | $489,000 | $3,293 | 4.53% |
| LANSING-EAST LANSING, MI (FHA|USDA|VA) | 1 | $2,395,000 | $2,395,000 | $0 | 5.75% |
| GREELEY, CO (FHA|USDA|VA) | 8 | $1,920,000 | $240,000 | $302 | 130.41% |
| PUEBLO, CO (FHA|USDA|VA) | 3 | $1,815,000 | $605,000 | $0 | 5.50% |
| Outside of Metro Areas | 3 | $835,000 | $278,333 | $4,141 | 5.33% |
| TAMPA-ST. PETERSBURG-CLEARWATER, FL (FHA|USDA|VA) | 1 | $575,000 | $575,000 | $5,520 | 4.50% |
| NASHVILLE-DAVIDSON-MURFREESBORO-FRANKLIN, TN (FHA|USDA|VA) | 1 | $575,000 | $575,000 | $5,378 | 4.75% |
| COLORADO SPRINGS, CO (FHA|USDA|VA) | 2 | $540,000 | $270,000 | $150 | 5.13% |
| Steamboat Springs, CO (FHA|USDA|VA) | 3 | $465,000 | $155,000 | $2,593 | 4.92% |
| FORT COLLINS, CO (FHA|USDA|VA) | 1 | $205,000 | $205,000 | $4,647 | 4.63% |
Similar Lenders
We use machine learning to identify the top lenders compared against Citywide Banks based on their rates and fees, along with other useful metrics. A lower similarity rank signals a stronger match.
Similarity Rank: 493
Similarity Rank: 548
Similarity Rank: 614
Similarity Rank: 985
Similarity Rank: 1080
Similarity Rank: 1148
Similarity Rank: 1404
Similarity Rank: 1470
Similarity Rank: 1776
Similarity Rank: 1927
Product Mix
| Loan Type | Originations | Total Value | Avg. Loan | Avg. Fees | Avg. Rate |
|---|---|---|---|---|---|
| Conventional | 153 | $101,685,000 | $664,608 | $4,223 | 11.85% |
For 2018, Citywide Banks's most frequently originated type of loan was Conventional, with 153 originations.
Loan Reason
For 2018, Citywide Banks's most frequently cited loan purpose was Home Purchase, with 87 originations. The 2nd most popular reason was Refi, with 34 originations.
Loan Duration/Length
For 2018, Citywide Banks's most frequently cited loan duration was 30 Year, with 50 originations. The 2nd most popular length was Other, with 26 originations.
Origination Fees/Closing Costs
Citywide Banks's average total fees were $6,729, while their most frequently occuring range of origination fees (closing costs) were in the $<1k bucket, with 28 originations.
Interest Rates
During 2018, Citywide Banks's average interest rate for loans was 4.56%, while their most frequently originated rate bucket for loans was 5-6%, with 65 originations.
Loan Sizing
2018 saw Citywide Banks place emphasis on $200k-400k loans with 46 originations, totaling $13,040,000 in origination value.
Applicant Income
Citywide Banks lent most frequently to those with incomes in the $250k+ range, with 24 originations. The second most popular income band? $150k-250k, with 22 originations.
Applicant Debt to Income Ratio
Citywide Banks lent most frequently to those with DTI ratios of 30-36%, with 24 originations. The next most common DTI ratio? 20-30%, with 19 originations.
Ethnicity Mix
Approval Rates
Total approvals of all applications90.23%
Citywide Banks has an average approval rate.
Pick Rate
Approvals leading to origination77.78%
Citywide Banks has a below average pick rate.
Points and Fees
| Points | Originations | Total Value | Average Loan |
|---|---|---|---|
| NA | 153 | $101,685,000 | $664,608 |
Occupancy Type Mix
LTV Distribution
Bank Details
Branches
| Bank Name | Branch | Branch Type | Deposits (000's) |
|---|---|---|---|
| Citywide Banks | 105 Edwards Village Boulevard, Suite D107 Edwards, CO 81632 | Full Service B&M | $22,196 |
| Citywide Banks | 10660 East Colfax Avenue Aurora, CO 80010 | Full Service B&M | $179,415 |
| Citywide Banks | 116 Lincoln Ave. Breckenridge, CO 80424 | Full Service B&M | $22,416 |
| Citywide Banks | 12075 East 45th Avenue Denver, CO 80239 | Full Service B&M | $111,051 |
| Citywide Banks | 1248 Bergen Pkwy Evergreen, CO 80439 | Full Service B&M | $54,838 |
| Citywide Banks | 12501 West 52nd Avenue Arvada, CO 80002 | Full Service B&M | $78,971 |
| Citywide Banks | 13700 East Arapahoe Road Centennial, CO 80112 | Full Service B&M | $127,686 |
| Citywide Banks | 13731 East Mississippi Avenue Aurora, CO 80012 | Full Service B&M | $111,148 |
| Citywide Banks | 1490 South Santa Fe Drive Denver, CO 80223 | Full Service B&M | $105,087 |
| Citywide Banks | 1611 Canyon Boulevard Boulder, CO 80302 | Full Service B&M | $43,968 |
| Citywide Banks | 16501 Washington Street Thornton, CO 80023 | Full Service B&M | $33,885 |
| Citywide Banks | 1744 Miner Street Idaho Springs, CO 80452 | Full Service B&M | $41,336 |
| Citywide Banks | 1800 Larimer St Ste. 100 Denver, CO 80202 | Full Service B&M | $211,811 |
| Citywide Banks | 1800 Larimer Street, Suite 100 Denver, CO 80202 | Full Service B&M | $0 |
| Citywide Banks | 199 South Briggs Street Erie, CO 80516 | Full Service B&M | $31,669 |
| Citywide Banks | 2002 East Coalton Road Broomfield, CO 80021 | Full Service B&M | $68,387 |
| Citywide Banks | 2111 North Frontage Road West, Suite A Vail, CO 81657 | Full Service B&M | $30,325 |
| Citywide Banks | 26 South Highway 119 Nederland, CO 80466 | Full Service B&M | $34,524 |
| Citywide Banks | 26679 Pleasant Park Road Conifer, CO 80433 | Full Service B&M | $33,497 |
| Citywide Banks | 3290 South Wadsworth Boulevard Lakewood, CO 80227 | Full Service B&M | $71,749 |
| Citywide Banks | 4600 So. Syracuse St Suite 150 Denver, CO 80237 | Full Service B&M | $101,747 |
| Citywide Banks | 55 Madison Street, Suite 100 Denver, CO 80206 | Full Service B&M | $168,172 |
| Citywide Banks | 635 Marketplace Plaza Steamboat Springs, CO 80487 | Full Service B&M | $24,037 |
| Citywide Banks | 6500 E Hampden Ave Denver, CO 80224 | Full Service B&M | $53,171 |
| Citywide Banks | 770 Heritage Road Golden, CO 80401 | Full Service B&M | $34,259 |
| Citywide Banks | 77699 Us Highway 40 Fraser, CO 80442 | Full Service B&M | $72,280 |
For 2018, Citywide Banks had 26 branches.
Yearly Performance Overview
Bank Income
| Item | Value (in 000's) |
|---|---|
| Total interest income | $99,529 |
| Net interest income | $94,002 |
| Total noninterest income | $10,554 |
| Gross Fiduciary activities income | $284 |
| Service charges on deposit accounts | $3,602 |
| Trading account gains and fees | $0 |
| Additional Noninterest Income | $6,668 |
| Pre-tax net operating income | $35,567 |
| Securities gains (or losses, -) | $151 |
| Income before extraordinary items | $27,248 |
| Discontinued Operations (Extraordinary gains, net) | $0 |
| Net income of bank and minority interests | $27,248 |
| Minority interest net income | $0 |
| Net income | $27,248 |
| Sale, conversion, retirement of capital stock, net | $0 |
| Net operating income | $27,128 |
Citywide Banks's gross interest income from loans was $99,529,000.
Citywide Banks's net interest income from loans was $94,002,000.
Citywide Banks's fee based income from loans was $3,602,000.
Citywide Banks's net income from loans was $27,248,000.
Bank Expenses
| Item | Value (in 000's) |
|---|---|
| Total interest expense | $5,527 |
| Provision for credit losses | $4,815 |
| Total noninterest expense | $64,174 |
| Salaries and employee benefits | $25,286 |
| Premises and equipment expense | $7,354 |
| Additional noninterest expense | $31,534 |
| Applicable income taxes | $8,470 |
| Net charge-offs | $1,015 |
| Cash dividends | $22,000 |
Citywide Banks's interest expense for loans was $5,527,000.
Citywide Banks's payroll and benefits expense were $25,286,000.
Citywide Banks's property, plant and equipment expenses $7,354,000.
Loan Performance
| Type of Loan | % of Loans Noncurrent (30+ days, end of period snapshot) |
|---|---|
| All loans | 0.0% |
| Real Estate loans | 0.0% |
| Construction & Land Development loans | 0.0% |
| Nonfarm, nonresidential loans | 0.0% |
| Multifamily residential loans | 0.0% |
| 1-4 family residential loans | 0.0% |
| HELOC loans | 0.0% |
| All other family | 0.0% |
| Commercial & industrial loans | 0.0% |
| Personal loans | 0.0% |
| Credit card loans | 0.4% |
| Other individual loans | 0.0% |
| Auto loans | 0.0% |
| Other consumer loans | 0.0% |
| Unsecured commercial real estate loans | 0.0% |
Deposits
| Type | Value (in 000's) |
|---|---|
| Total deposits | $1,848,373 |
| Deposits held in domestic offices | $1,848,373 |
| Deposits by Individuals, partnerships, and corporations | $1,759,252 |
| Deposits by U.S. Government | $4 |
| Deposits by States and political subdivisions in the U.S. | $88,468 |
| Deposits by Commercial banks and other depository institutions in U.S. | $0 |
| Deposits by Banks in foreign countries | $649 |
| Deposits by Foreign governments and official institutions | $0 |
| Transaction accounts | $334,062 |
| Demand deposits | $250,274 |
| Nontransaction accounts | $1,514,311 |
| Money market deposit accounts (MMDAs) | $1,242,277 |
| Other savings deposits (excluding MMDAs) | $148,031 |
| Total time deposits | $124,003 |
| Total time and savings deposits | $1,598,099 |
| Noninterest-bearing deposits | $758,419 |
| Interest-bearing deposits | $1,089,954 |
| Retail deposits | $1,815,424 |
| IRAs and Keogh plan accounts | $22,538 |
| Brokered deposits | $1 |
| Deposits held in foreign offices | $0 |
Assets
| Asset | Value (in 000's) |
|---|---|
| Total Assets | $2,307,284 |
| Cash & Balances due from depository institutions | $56,684 |
| Interest-bearing balances | $5,940 |
| Total securities | $556,400 |
| Federal funds sold & reverse repurchase | $0 |
| Net loans and leases | $1,467,000 |
| Loan and leases loss allowance | $9,033 |
| Trading account assets | $276 |
| Bank premises and fixed assets | $38,425 |
| Other real estate owned | $3,011 |
| Goodwill and other intangibles | $141,371 |
| All other assets | $44,117 |
Liabilities
| Liabilities | Value (in 000's) |
|---|---|
| Total liabilities and capital | $2,307,284 |
| Total Liabilities | $1,947,808 |
| Total deposits | $1,848,373 |
| Interest-bearing deposits | $1,089,954 |
| Deposits held in domestic offices | $1,848,373 |
| % insured (estimated) | $56 |
| Federal funds purchased and repurchase agreements | $56,056 |
| Trading liabilities | $276 |
| Other borrowed funds | $33,187 |
| Subordinated debt | $0 |
| All other liabilities | $9,916 |
Issued Loan Types
| Type | Value (in 000's) |
|---|---|
| Net loans and leases | $1,467,000 |
| Loan and leases loss allowance | $9,033 |
| Total loans and leases (domestic) | $1,476,033 |
| All real estate loans | $1,148,046 |
| Real estate loans in domestic offices | $1,148,046 |
| Construction and development loans | $240,735 |
| Residential 1-4 family construction | $53,502 |
| Other construction, all land development and other land | $187,233 |
| Loans secured by nonfarm nonresidential properties | $582,959 |
| Nonfarm nonresidential secured by owner-occupied properties | $297,893 |
| Commercial real estate & other non-farm, non-residential | $285,066 |
| Multifamily residential real estate | $35,468 |
| 1-4 family residential loans | $283,188 |
| Farmland loans | $5,696 |
| Loans held in foreign offices | $0 |
| Farm loans | $449 |
| Commercial and industrial loans | $300,383 |
| To non-U.S. addressees | $0 |
| Loans to individuals | $10,516 |
| Credit card loans | $511 |
| Related Plans | $4,644 |
| Consumer Auto Loans | $4,090 |
| Other loans to individuals | $1,271 |
| All other loans & leases | $20,091 |
| Loans to foreign governments and official institutions | $0 |
| Other loans | $295 |
| Loans to depository institutions and acceptances of other banks | $0 |
| Loans not secured by real estate | $998 |
| Loans secured by real estate to non-U.S. addressees | $0 |
| Restructured Loans & leases | $0 |
| Non 1-4 family restructured loans & leases | $0 |
| Total loans and leases (foreign) | $0 |
Citywide Banks had $1,467,000,000 of loans outstanding in 2018. $1,148,046,000 of loans were in real estate loans. $240,735,000 of loans were in development loans. $35,468,000 of loans were in multifamily mortgage loans. $283,188,000 of loans were in 1-4 family mortgage loans. $449,000 of loans were in farm loans. $511,000 of loans were in credit card loans. $4,090,000 of loans were in the auto loan category.
Small Business Loans
| Categorization | # of Loans in Category | $ amount of loans (in 000's) | Average $/loan |
|---|---|---|---|
| Nonfarm, nonresidential loans - <$1MM | 484 | $140,322 | $289,921 |
| Nonfarm, nonresidential loans - <$100k | 54 | $2,232 | $41,333 |
| Nonfarm, nonresidential loans - $100-250k | 134 | $17,428 | $130,060 |
| Nonfarm, nonresidential loans - $250k-1MM | 296 | $120,662 | $407,642 |
| Commercial & Industrial, US addressed loans - <$1MM | 1,256 | $104,636 | $83,309 |
| Commercial & Industrial, US addressed loans - <$100k | 719 | $14,788 | $20,567 |
| Commercial & Industrial, US addressed loans - $100-250k | 225 | $17,987 | $79,942 |
| Commercial & Industrial, US addressed loans - $250k-1MM | 312 | $71,861 | $230,324 |
| Farmland loans - <$1MM | 1 | $250 | $250,000 |
| Farmland loans - $100-250k | 1 | $250 | $250,000 |
| Agriculture operations loans - <$1MM | 2 | $42 | $21,000 |
| Agriculture operations loans - <$100k | 2 | $42 | $21,000 |