Farmers & Stockmens Bank Mortgage Rates, Fees & Info
Clayton, NMLEI: 549300BMHSUCH6UGU556
Tax ID: 85-0036360
Latest/2024 | 2023 Data | 2022 Data | 2021 Data | 2020 Data | 2019 Data | 2018 Data
Jump to:
Mortgage Data
Bank Data
Review & Overview
Farmers & Stockmens Bank is a smaller bank specializing in Home Purchase and Refi loans. Farmers & Stockmens Bank has a high proportion of conventional loans. They have a a low proportion of FHA loans. (This may mean they shy away from first time homebuyers.) Their top markets by origination volume include: Colorado Springs, Denver, Pueblo, Charleston, and Cañon City among others. We have data for 31 markets. (Some data included below & more in-depth data is available with an active subscription.)Farmers & Stockmens Bank has an above average approval rate when compared to the average across all lenders. They have a below average pick rate when compared to similar lenders. Farmers & Stockmens Bank is typically a low fee lender. (We use the term "fees" to include things like closing costs and other costs incurred by borrowers-- whether they are paid out of pocket or rolled into the loan.) They typically have about average rates.
We show data for every lender and do not change our ratings-- even if an organization is a paid advertiser. Our consensus data does have lag, but it is highly correlated to a lender's rates & fees relative to their markets. This means that if a bank is a low fee/rate lender the past-- chances are they are still one today. Our SimulatedRates™ use advanced statistical techniques to forecast different rates based on a lender's historical data.
Mortgage seekers: Choose your metro area here to explore the lowest fee & rate lenders.
Mortgage professionals: We have various tools to make your lives easier. Contact us to see how we can help with your market research, analytics or advertising needs.
Originations
545Origination Dollar Volume (All Markets)
$191,585,000Employee count
101Awards
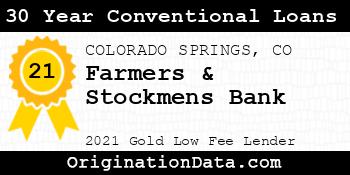
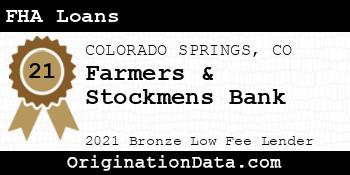
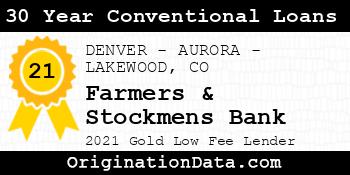
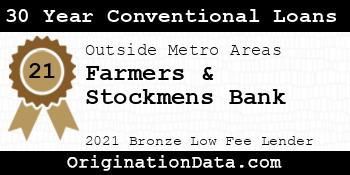
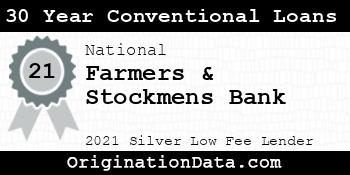
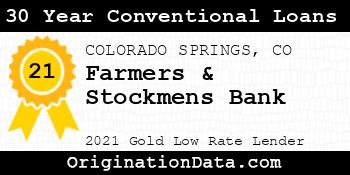
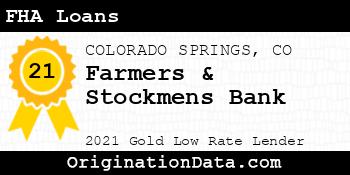
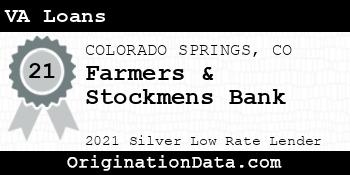
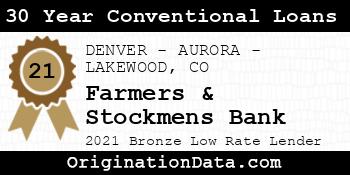
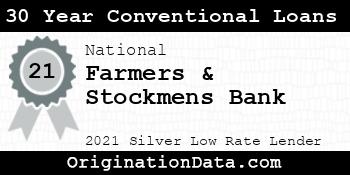
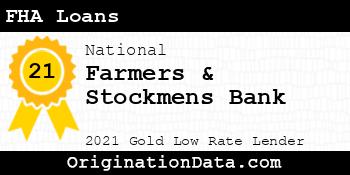
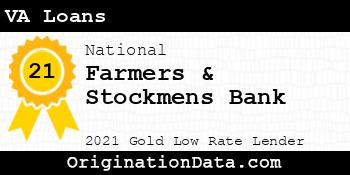
Farmers & Stockmens Bank - 2021
Farmers & Stockmens Bank is a 2021 , due to their low .
For 2021, less than of lenders were eligible for this award.
Work for Farmers & Stockmens Bank?
Use this award on your own site. Either save and use the images below, or pass the provided image embed code to your development team.
Top Markets
Zoom/scroll map to see bank's per metro statistics. Subscribers can configure state/metro/county granularity, assorted fields and quantity of results. This map shows top 10 markets in the map viewport, as defined by descending origination volume.
| Market | Originations | Total Value | Average Loan | Average Fees | Average Rate |
|---|---|---|---|---|---|
| COLORADO SPRINGS, CO (FHA|USDA|VA) | 368 | $131,080,000 | $356,196 | $4,420 | 2.62% |
| DENVER-AURORA-LAKEWOOD, CO (FHA|USDA|VA) | 104 | $40,370,000 | $388,173 | $2,434 | 2.78% |
| Outside of Metro Areas | 20 | $3,960,000 | $198,000 | $2,241 | 4.60% |
| PUEBLO, CO (FHA|USDA|VA) | 15 | $3,525,000 | $235,000 | $5,090 | 2.64% |
| CHARLESTON-NORTH CHARLESTON, SC (FHA|USDA|VA) | 3 | $1,495,000 | $498,333 | $3,839 | 3.25% |
| Cañon City, CO (FHA|USDA|VA) | 4 | $1,150,000 | $287,500 | $9,332 | 2.72% |
| PHOENIX-MESA-CHANDLER, AZ (FHA|USDA|VA) | 2 | $1,090,000 | $545,000 | $3,924 | 3.13% |
| GRAND JUNCTION, CO (FHA|USDA|VA) | 2 | $890,000 | $445,000 | $2,099 | 2.69% |
| Washington-Arlington-Alexandria, DC-VA-MD-WV (FHA|USDA|VA) | 2 | $810,000 | $405,000 | $1,234 | 2.44% |
| Dallas-Fort Worth-Arlington, TX (FHA|USDA|VA) | 1 | $655,000 | $655,000 | $0 | 2.75% |
| Seattle-Tacoma-Bellevue, WA (FHA|USDA|VA) | 1 | $645,000 | $645,000 | $17,288 | 2.75% |
| FORT COLLINS, CO (FHA|USDA|VA) | 3 | $635,000 | $211,667 | $1,861 | 2.83% |
| PORTLAND-VANCOUVER-HILLSBORO, OR-WA (FHA|USDA|VA) | 1 | $475,000 | $475,000 | $4,038 | 2.63% |
| AMARILLO, TX (FHA|USDA|VA) | 1 | $445,000 | $445,000 | $2,767 | 3.13% |
| COLUMBIA, SC (FHA|USDA|VA) | 1 | $395,000 | $395,000 | $1,061 | 2.50% |
| GREELEY, CO (FHA|USDA|VA) | 1 | $385,000 | $385,000 | $1,954 | 3.38% |
| KILLEEN-TEMPLE, TX (FHA|USDA|VA) | 1 | $355,000 | $355,000 | $16,840 | 2.38% |
| Outside of Metro Areas | 1 | $345,000 | $345,000 | $0 | 2.25% |
| Edwards, CO (FHA|USDA|VA) | 1 | $335,000 | $335,000 | $917 | 2.88% |
| ST. GEORGE, UT (FHA|USDA|VA) | 1 | $305,000 | $305,000 | $1,126 | 3.25% |
| RALEIGH-CARY, NC (FHA|USDA|VA) | 1 | $275,000 | $275,000 | $1,500 | 3.13% |
| IDAHO FALLS, ID (FHA|USDA|VA) | 1 | $275,000 | $275,000 | $3,210 | 2.25% |
| OMAHA-COUNCIL BLUFFS, NE-IA (FHA|USDA|VA) | 1 | $265,000 | $265,000 | $704 | 2.50% |
| YORK-HANOVER, PA (FHA|USDA|VA) | 1 | $245,000 | $245,000 | $2,896 | 2.63% |
| HOUSTON-THE WOODLANDS-SUGAR LAND, TX (FHA|USDA|VA) | 1 | $235,000 | $235,000 | $0 | 3.38% |
| North Port-Sarasota-Bradenton, FL (FHA|USDA|VA) | 1 | $215,000 | $215,000 | $3,100 | 2.75% |
| BOULDER, CO (FHA|USDA|VA) | 1 | $165,000 | $165,000 | $3,069 | 2.25% |
| LEXINGTON-FAYETTE, KY (FHA|USDA|VA) | 1 | $165,000 | $165,000 | $1,470 | 2.88% |
| Las Vegas, NM (FHA|USDA|VA) | 2 | $150,000 | $75,000 | $3,242 | 4.56% |
| MILWAUKEE-WAUKESHA, WI (FHA|USDA|VA) | 1 | $135,000 | $135,000 | $1,954 | 3.50% |
| HICKORY-LENOIR-MORGANTON, NC (FHA|USDA|VA) | 1 | $115,000 | $115,000 | $0 | 3.75% |
Similar Lenders
We use machine learning to identify the top lenders compared against Farmers & Stockmens Bank based on their rates and fees, along with other useful metrics. A lower similarity rank signals a stronger match.
Similarity Rank: 882
Similarity Rank: 930
Similarity Rank: 1344
Similarity Rank: 1540
Similarity Rank: 1830
Similarity Rank: 1984
Similarity Rank: 2170
Similarity Rank: 2432
Similarity Rank: 2604
Similarity Rank: 2700
Product Mix
| Loan Type | Originations | Total Value | Avg. Loan | Avg. Fees | Avg. Rate |
|---|---|---|---|---|---|
| Conventional | 358 | $113,330,000 | $316,564 | $2,346 | 2.94% |
| VA | 172 | $73,360,000 | $426,512 | $6,530 | 2.37% |
| FHA | 15 | $4,895,000 | $326,333 | $7,293 | 2.40% |
For 2021, Farmers & Stockmens Bank's most frequently originated type of loan was Conventional, with 358 originations. Their 2nd most popular type was VA, with 172 originations.
Loan Reason
For 2021, Farmers & Stockmens Bank's most frequently cited loan purpose was Home Purchase, with 223 originations. The 2nd most popular reason was Refi, with 212 originations.
Loan Duration/Length
For 2021, Farmers & Stockmens Bank's most frequently cited loan duration was 30 Year, with 476 originations. The 2nd most popular length was 15 Year, with 40 originations.
Origination Fees/Closing Costs
Farmers & Stockmens Bank's average total fees were $4,154, while their most frequently occuring range of origination fees (closing costs) were in the $<1k bucket, with 427 originations.
Interest Rates
During 2021, Farmers & Stockmens Bank's average interest rate for loans was 2.72%, while their most frequently originated rate bucket for loans was <2.5%, with 230 originations.
Loan Sizing
2021 saw Farmers & Stockmens Bank place emphasis on $200k-400k loans with 276 originations, totaling $85,210,000 in origination value.
Applicant Income
Farmers & Stockmens Bank lent most frequently to those with incomes in the $100k-150k range, with 126 originations. The second most popular income band? $75k-100k, with 99 originations.
Applicant Debt to Income Ratio
Farmers & Stockmens Bank lent most frequently to those with DTI ratios of 20-30%, with 137 originations. The next most common DTI ratio? 30-36%, with 90 originations.
Ethnicity Mix
Approval Rates
Total approvals of all applications98.00%
Farmers & Stockmens Bank has an exceptionally high approval rate. They either target their audience very well or may have lax underwriting protocols.
Pick Rate
Approvals leading to origination86.24%
Farmers & Stockmens Bank has an average pick rate.
Points and Fees
| Points | Originations | Total Value | Average Loan |
|---|---|---|---|
| NA | 545 | $191,585,000 | $351,532 |
LTV Distribution
Bank Details
Branches
| Bank Name | Branch | Branch Type | Deposits (000's) |
|---|---|---|---|
| Farmers & Stockmens Bank | 1 South Nevada Avenue Colorado Springs, CO 80903 | Full Service B&M | $183,048 |
| Farmers & Stockmens Bank | 22 Maple Street Clayton, NM 88415 | Full Service B&M | $68,957 |
| Farmers & Stockmens Bank | 405 Chicosa Street Roy, NM 87743 | Full Service B&M | $13,628 |
| Farmers & Stockmens Bank | 4582 South Ulster Street, Suite 150 Denver, CO 80237 | Full Service B&M | $69,613 |
| Farmers & Stockmens Bank | Highway 87 Des Moines, NM 88418 | Full Service B&M | $6,596 |
For 2021, Farmers & Stockmens Bank had 5 branches.
Yearly Performance Overview
Bank Income
| Item | Value (in 000's) |
|---|---|
| Total interest income | $17,504 |
| Net interest income | $16,370 |
| Total noninterest income | $11,332 |
| Gross Fiduciary activities income | $2,457 |
| Service charges on deposit accounts | $312 |
| Trading account gains and fees | $0 |
| Additional Noninterest Income | $8,563 |
| Pre-tax net operating income | $6,371 |
| Securities gains (or losses, -) | $0 |
| Income before extraordinary items | $6,371 |
| Discontinued Operations (Extraordinary gains, net) | $0 |
| Net income of bank and minority interests | $6,371 |
| Minority interest net income | $0 |
| Net income | $6,371 |
| Sale, conversion, retirement of capital stock, net | $0 |
| Net operating income | $6,371 |
Farmers & Stockmens Bank's gross interest income from loans was $17,504,000.
Farmers & Stockmens Bank's net interest income from loans was $16,370,000.
Farmers & Stockmens Bank's fee based income from loans was $312,000.
Farmers & Stockmens Bank's net income from loans was $6,371,000.
Bank Expenses
| Item | Value (in 000's) |
|---|---|
| Total interest expense | $1,134 |
| Provision for credit losses | $915 |
| Total noninterest expense | $20,416 |
| Salaries and employee benefits | $14,293 |
| Premises and equipment expense | $1,273 |
| Additional noninterest expense | $4,850 |
| Applicable income taxes | $0 |
| Net charge-offs | $9 |
| Cash dividends | $4,069 |
Farmers & Stockmens Bank's interest expense for loans was $1,134,000.
Farmers & Stockmens Bank's payroll and benefits expense were $14,293,000.
Farmers & Stockmens Bank's property, plant and equipment expenses $1,273,000.
Loan Performance
| Type of Loan | % of Loans Noncurrent (30+ days, end of period snapshot) |
|---|---|
| All loans | 0.0% |
| Real Estate loans | 0.0% |
| Construction & Land Development loans | 0.0% |
| Nonfarm, nonresidential loans | 0.0% |
| Multifamily residential loans | 0.0% |
| 1-4 family residential loans | 0.0% |
| HELOC loans | 0.0% |
| All other family | 0.0% |
| Commercial & industrial loans | 0.0% |
| Personal loans | 0.0% |
| Credit card loans | 0.0% |
| Other individual loans | 0.0% |
| Auto loans | 0.0% |
| Other consumer loans | 0.0% |
| Unsecured commercial real estate loans | 0.0% |
Deposits
| Type | Value (in 000's) |
|---|---|
| Total deposits | $498,983 |
| Deposits held in domestic offices | $498,983 |
| Deposits by Individuals, partnerships, and corporations | $476,070 |
| Deposits by U.S. Government | $0 |
| Deposits by States and political subdivisions in the U.S. | $22,913 |
| Deposits by Commercial banks and other depository institutions in U.S. | $0 |
| Deposits by Banks in foreign countries | $0 |
| Deposits by Foreign governments and official institutions | $0 |
| Transaction accounts | $293,009 |
| Demand deposits | $251,668 |
| Nontransaction accounts | $205,974 |
| Money market deposit accounts (MMDAs) | $172,785 |
| Other savings deposits (excluding MMDAs) | $14,608 |
| Total time deposits | $18,580 |
| Total time and savings deposits | $247,315 |
| Noninterest-bearing deposits | $251,668 |
| Interest-bearing deposits | $247,315 |
| Retail deposits | $496,905 |
| IRAs and Keogh plan accounts | $3,200 |
| Brokered deposits | $0 |
| Deposits held in foreign offices | $0 |
Assets
| Asset | Value (in 000's) |
|---|---|
| Total Assets | $560,163 |
| Cash & Balances due from depository institutions | $49,027 |
| Interest-bearing balances | $44,660 |
| Total securities | $13,083 |
| Federal funds sold & reverse repurchase | $208,313 |
| Net loans and leases | $280,376 |
| Loan and leases loss allowance | $4,341 |
| Trading account assets | $0 |
| Bank premises and fixed assets | $2,451 |
| Other real estate owned | $0 |
| Goodwill and other intangibles | $3,497 |
| All other assets | $3,416 |
Liabilities
| Liabilities | Value (in 000's) |
|---|---|
| Total liabilities and capital | $560,163 |
| Total Liabilities | $512,683 |
| Total deposits | $498,983 |
| Interest-bearing deposits | $247,315 |
| Deposits held in domestic offices | $498,983 |
| % insured (estimated) | $40 |
| Federal funds purchased and repurchase agreements | $0 |
| Trading liabilities | $0 |
| Other borrowed funds | $11,748 |
| Subordinated debt | $0 |
| All other liabilities | $1,952 |
Issued Loan Types
| Type | Value (in 000's) |
|---|---|
| Net loans and leases | $280,376 |
| Loan and leases loss allowance | $4,341 |
| Total loans and leases (domestic) | $284,717 |
| All real estate loans | $206,306 |
| Real estate loans in domestic offices | $206,306 |
| Construction and development loans | $30,375 |
| Residential 1-4 family construction | $12,445 |
| Other construction, all land development and other land | $17,930 |
| Loans secured by nonfarm nonresidential properties | $135,527 |
| Nonfarm nonresidential secured by owner-occupied properties | $85,608 |
| Commercial real estate & other non-farm, non-residential | $49,919 |
| Multifamily residential real estate | $1,705 |
| 1-4 family residential loans | $14,374 |
| Farmland loans | $24,325 |
| Loans held in foreign offices | $0 |
| Farm loans | $20,180 |
| Commercial and industrial loans | $54,824 |
| To non-U.S. addressees | $0 |
| Loans to individuals | $3,377 |
| Credit card loans | $0 |
| Related Plans | $0 |
| Consumer Auto Loans | $1,222 |
| Other loans to individuals | $2,155 |
| All other loans & leases | $29 |
| Loans to foreign governments and official institutions | $0 |
| Other loans | $29 |
| Loans to depository institutions and acceptances of other banks | $0 |
| Loans not secured by real estate | $0 |
| Loans secured by real estate to non-U.S. addressees | $0 |
| Restructured Loans & leases | $160 |
| Non 1-4 family restructured loans & leases | $160 |
| Total loans and leases (foreign) | $0 |
Farmers & Stockmens Bank had $280,376,000 of loans outstanding in 2021. $206,306,000 of loans were in real estate loans. $30,375,000 of loans were in development loans. $1,705,000 of loans were in multifamily mortgage loans. $14,374,000 of loans were in 1-4 family mortgage loans. $20,180,000 of loans were in farm loans. $0 of loans were in credit card loans. $1,222,000 of loans were in the auto loan category.
Small Business Loans
| Categorization | # of Loans in Category | $ amount of loans (in 000's) | Average $/loan |
|---|---|---|---|
| Nonfarm, nonresidential loans - <$1MM | 98 | $30,805 | $314,337 |
| Nonfarm, nonresidential loans - <$100k | 11 | $435 | $39,545 |
| Nonfarm, nonresidential loans - $100-250k | 16 | $1,541 | $96,313 |
| Nonfarm, nonresidential loans - $250k-1MM | 71 | $28,829 | $406,042 |
| Commercial & Industrial, US addressed loans - <$1MM | 213 | $21,525 | $101,056 |
| Commercial & Industrial, US addressed loans - <$100k | 114 | $3,013 | $26,430 |
| Commercial & Industrial, US addressed loans - $100-250k | 48 | $4,460 | $92,917 |
| Commercial & Industrial, US addressed loans - $250k-1MM | 51 | $14,052 | $275,529 |
| Farmland loans - <$1MM | 42 | $6,554 | $156,048 |
| Farmland loans - <$100k | 11 | $528 | $48,000 |
| Farmland loans - $100-250k | 19 | $3,045 | $160,263 |
| Farmland loans - $250k-1MM | 12 | $2,981 | $248,417 |
| Agriculture operations loans - <$1MM | 143 | $8,032 | $56,168 |
| Agriculture operations loans - <$100k | 94 | $1,617 | $17,202 |
| Agriculture operations loans - $100-250k | 29 | $1,957 | $67,483 |
| Agriculture operations loans - $250k-1MM | 20 | $4,458 | $222,900 |