Bank Of Hope Mortgage Rates, Fees & Info
Los Angeles, CALEI: 549300F570XAWYN8Z237
Tax ID: 95-3972168
Latest/2024 | 2023 Data | 2022 Data | 2021 Data | 2020 Data | 2019 Data | 2018 Data
Jump to:
Mortgage Data
Bank Data
Review & Overview
Bank Of Hope is a smaller bank specializing in Refi and Cash Out Refi loans. Bank Of Hope has a high proportion of conventional loans. Their top markets by origination volume include: Los Angeles, San Diego, New York, Seattle, and Riverside among others. We have data for 29 markets. (Some data included below & more in-depth data is available with an active subscription.)Bank Of Hope has an above average approval rate when compared to the average across all lenders. They have a below average pick rate when compared to similar lenders. Bank Of Hope is typically a low fee lender. (We use the term "fees" to include things like closing costs and other costs incurred by borrowers-- whether they are paid out of pocket or rolled into the loan.) They typically have about average rates.
We show data for every lender and do not change our ratings-- even if an organization is a paid advertiser. Our consensus data does have lag, but it is highly correlated to a lender's rates & fees relative to their markets. This means that if a bank is a low fee/rate lender the past-- chances are they are still one today. Our SimulatedRates™ use advanced statistical techniques to forecast different rates based on a lender's historical data.
Mortgage seekers: Choose your metro area here to explore the lowest fee & rate lenders.
Mortgage professionals: We have various tools to make your lives easier. Contact us to see how we can help with your market research, analytics or advertising needs.
SimulatedRates™Mortgage Type |
Simulated Rate | Simulation Date |
|---|---|---|
| 30 Year Conventional Purchase | 7.32% | 1/25/26 |
| 30 Year Conventional Refi | 7.24% | 1/25/26 |
| 30 Year Cash-out Refi | 7.47% | 1/25/26 |
| 15 Year Conventional Purchase | 5.84% | 1/25/26 |
| These are simulated rates generated by our proprietary machine learning models. These are not guaranteed by the bank. They are our estimates based on a lender's past behaviors combined with current market conditions. Contact an individual lender for their actual rates. Our models use fixed rate terms for conforming loans, 700+ FICO, 10% down for FHA and 20% for conventional. These are based on consensus, historical data-- not advertised promotional rates. | ||
Bank Of Hope Mortgage Calculator
Your Estimates
Estimated Loan Payment: Update the calculator values and click calculate payment!
This is not an official calculator from Bank Of Hope. It uses our SimulatedRate™
technology, basic math and reasonable assumptions to calculate mortgage payments derived from our simulations and your inputs.
The default purchase price is the median sales price across the US for 2022Q4, per FRED.
Originations
702Origination Dollar Volume (All Markets)
$371,000,000Employee count
1,431Awards
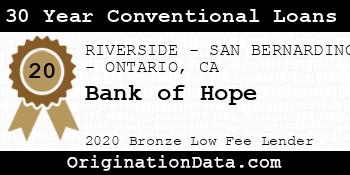
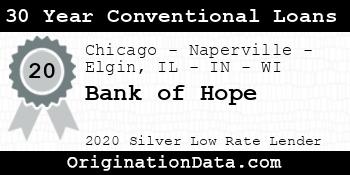
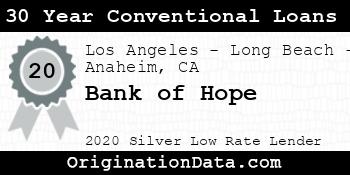
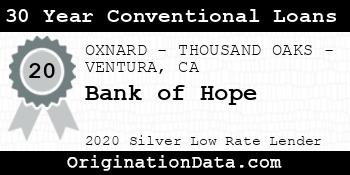
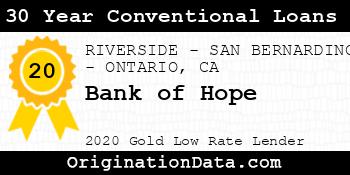
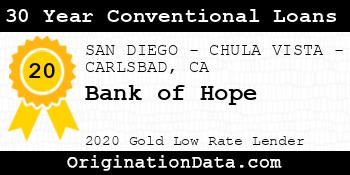
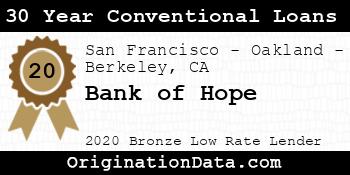
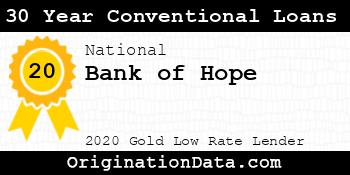
Bank of Hope - 2020
Bank of Hope is a 2020 , due to their low .
For 2020, less than of lenders were eligible for this award.
Work for Bank of Hope?
Use this award on your own site. Either save and use the images below, or pass the provided image embed code to your development team.
Top Markets
Zoom/scroll map to see bank's per metro statistics. Subscribers can configure state/metro/county granularity, assorted fields and quantity of results. This map shows top 10 markets in the map viewport, as defined by descending origination volume.
| Market | Originations | Total Value | Average Loan | Average Fees | Average Rate |
|---|---|---|---|---|---|
| Los Angeles-Long Beach-Anaheim, CA (FHA|USDA|VA) | 447 | $235,615,000 | $527,103 | $3,950 | 2.97% |
| SAN DIEGO-CHULA VISTA-CARLSBAD, CA (FHA|USDA|VA) | 55 | $22,395,000 | $407,182 | $3,654 | 2.91% |
| New York-Newark-Jersey City, NY-NJ-PA (FHA|USDA|VA) | 18 | $19,280,000 | $1,071,111 | $5,652 | 3.49% |
| Seattle-Tacoma-Bellevue, WA (FHA|USDA|VA) | 12 | $18,080,000 | $1,506,667 | $3,553 | 2.97% |
| RIVERSIDE-SAN BERNARDINO-ONTARIO, CA (FHA|USDA|VA) | 42 | $15,460,000 | $368,095 | $3,556 | 2.92% |
| San Francisco-Oakland-Berkeley, CA (FHA|USDA|VA) | 20 | $11,040,000 | $552,000 | $3,722 | 2.84% |
| OXNARD-THOUSAND OAKS-VENTURA, CA (FHA|USDA|VA) | 23 | $10,735,000 | $466,739 | $4,124 | 3.15% |
| Chicago-Naperville-Elgin, IL-IN-WI (FHA|USDA|VA) | 32 | $9,130,000 | $285,313 | $3,401 | 3.25% |
| SAN JOSE-SUNNYVALE-SANTA CLARA, CA (FHA|USDA|VA) | 7 | $5,345,000 | $763,571 | $3,779 | 2.99% |
| PHOENIX-MESA-CHANDLER, AZ (FHA|USDA|VA) | 3 | $4,275,000 | $1,425,000 | $2,546 | 3.21% |
| SACRAMENTO-ROSEVILLE-FOLSOM, CA (FHA|USDA|VA) | 5 | $2,975,000 | $595,000 | $4,121 | 3.08% |
| Dallas-Fort Worth-Arlington, TX (FHA|USDA|VA) | 9 | $2,855,000 | $317,222 | $4,328 | 2.63% |
| SANTA MARIA-SANTA BARBARA, CA (FHA|USDA|VA) | 6 | $2,410,000 | $401,667 | $3,331 | 3.13% |
| HOUSTON-THE WOODLANDS-SUGAR LAND, TX (FHA|USDA|VA) | 2 | $2,350,000 | $1,175,000 | $0 | 3.73% |
| SANTA ROSA-PETALUMA, CA (FHA|USDA|VA) | 3 | $1,495,000 | $498,333 | $5,541 | 2.83% |
| TUCSON, AZ (FHA|USDA|VA) | 2 | $1,170,000 | $585,000 | $4,635 | 3.13% |
| SAN LUIS OBISPO-PASO ROBLES, CA (FHA|USDA|VA) | 3 | $985,000 | $328,333 | $3,578 | 2.92% |
| Washington-Arlington-Alexandria, DC-VA-MD-WV (FHA|USDA|VA) | 2 | $760,000 | $380,000 | $2,929 | 2.75% |
| MADERA, CA (FHA|USDA|VA) | 1 | $755,000 | $755,000 | $0 | 3.40% |
| MODESTO, CA (FHA|USDA|VA) | 1 | $505,000 | $505,000 | $0 | 3.50% |
| VALLEJO, CA (FHA|USDA|VA) | 1 | $475,000 | $475,000 | $4,361 | 2.75% |
| BREMERTON-SILVERDALE-PORT ORCHARD, WA (FHA|USDA|VA) | 1 | $445,000 | $445,000 | $2,884 | 2.88% |
| NAPA, CA (FHA|USDA|VA) | 1 | $445,000 | $445,000 | $5,188 | 2.88% |
| LAKE HAVASU CITY-KINGMAN, AZ (FHA|USDA|VA) | 1 | $415,000 | $415,000 | $3,290 | 3.38% |
| STOCKTON, CA (FHA|USDA|VA) | 1 | $405,000 | $405,000 | $3,035 | 3.13% |
| Edwards, CO (FHA|USDA|VA) | 1 | $395,000 | $395,000 | $3,699 | 2.88% |
| SALINAS, CA (FHA|USDA|VA) | 1 | $375,000 | $375,000 | $0 | 3.49% |
| Outside of Metro Areas | 1 | $225,000 | $225,000 | $4,672 | 2.63% |
| PORTLAND-VANCOUVER-HILLSBORO, OR-WA (FHA|USDA|VA) | 1 | $205,000 | $205,000 | $3,327 | 3.13% |
Similar Lenders
We use machine learning to identify the top lenders compared against Bank of Hope based on their rates and fees, along with other useful metrics. A lower similarity rank signals a stronger match.
Similarity Rank: 134
Similarity Rank: 247
Similarity Rank: 312
Similarity Rank: 312
Similarity Rank: 345
Similarity Rank: 378
Similarity Rank: 384
Similarity Rank: 482
Similarity Rank: 538
Similarity Rank: 560
Product Mix
| Loan Type | Originations | Total Value | Avg. Loan | Avg. Fees | Avg. Rate |
|---|---|---|---|---|---|
| Conventional | 702 | $371,000,000 | $528,490 | $3,889 | 2.99% |
For 2020, Bank Of Hope's most frequently originated type of loan was Conventional, with 702 originations.
Loan Reason
For 2020, Bank Of Hope's most frequently cited loan purpose was Refi, with 483 originations. The 2nd most popular reason was Cash Out Refi, with 140 originations.
Loan Duration/Length
For 2020, Bank Of Hope's most frequently cited loan duration was 30 Year, with 447 originations. The 2nd most popular length was 15 Year, with 152 originations.
Origination Fees/Closing Costs
Bank Of Hope's average total fees were $4,098, while their most frequently occuring range of origination fees (closing costs) were in the $1k-2k bucket, with 500 originations.
Interest Rates
| Loan Rate | Originations | Total Value | Average Loan |
|---|---|---|---|
| 2.5-3% | 309 | $130,255,000 | $421,537 |
| 3-4% | 252 | $191,890,000 | $761,468 |
| <2.5% | 130 | $43,420,000 | $334,000 |
| 4-5% | 9 | $4,885,000 | $542,778 |
| 5-6% | 2 | $550,000 | $275,000 |
During 2020, Bank Of Hope's average interest rate for loans was 3.06%, while their most frequently originated rate bucket for loans was 2.5-3%, with 309 originations.
Loan Sizing
2020 saw Bank Of Hope place emphasis on $400k-600k loans with 265 originations, totaling $128,435,000 in origination value.
Applicant Income
Bank Of Hope lent most frequently to those with incomes in the $150k-250k range, with 171 originations. The second most popular income band? $100k-150k, with 130 originations.
Applicant Debt to Income Ratio
Bank Of Hope lent most frequently to those with DTI ratios of 20-30%, with 147 originations. The next most common DTI ratio? 30-36%, with 100 originations.
Ethnicity Mix
Approval Rates
Total approvals of all applications95.43%
Bank Of Hope has an exceptionally high approval rate. They either target their audience very well or may have lax underwriting protocols.
Pick Rate
Approvals leading to origination80.63%
Bank Of Hope has a below average pick rate.
Points and Fees
| Points | Originations | Total Value | Average Loan |
|---|---|---|---|
| NA | 702 | $371,000,000 | $528,490 |
Occupancy Type Mix
| Dwelling Type | Originations | Total Value | Average Loan |
|---|---|---|---|
| Multifamily:Site-Built | 52 | $89,920,000 | $1,729,231 |
| Single Family (1-4 Units):Site-Built | 650 | $281,080,000 | $432,431 |
LTV Distribution
Complaints
| Bank Name | Product | Issue | 2020 CPFB Complaints | % of Total Issues |
|---|---|---|---|---|
| BANK OF THE WEST | Conventional home mortgage | Incorrect information on your report | 1 | 3.8% |
| BANK OF THE WEST | Conventional home mortgage | Closing on a mortgage | 2 | 7.7% |
| BANK OF THE WEST | Other type of mortgage | Trouble during payment process | 4 | 15.4% |
| BANK OF THE WEST | Other type of mortgage | Struggling to pay mortgage | 2 | 7.7% |
| BANK OF THE WEST | Other type of mortgage | Applying for a mortgage or refinancing an existing mortgage | 1 | 3.8% |
| BANK OF THE WEST | Home equity loan or line of credit (HELOC) | Trouble during payment process | 6 | 23.1% |
| BANK OF THE WEST | Home equity loan or line of credit (HELOC) | Struggling to pay mortgage | 1 | 3.8% |
| BANK OF THE WEST | Home equity loan or line of credit (HELOC) | Closing on a mortgage | 2 | 7.7% |
| BANK OF THE WEST | Conventional home mortgage | Trouble during payment process | 4 | 15.4% |
| BANK OF THE WEST | Conventional home mortgage | Applying for a mortgage or refinancing an existing mortgage | 2 | 7.7% |
| BANK OF THE WEST | Conventional home mortgage | Struggling to pay mortgage | 1 | 3.8% |
Bank Details
Branches
| Bank Name | Branch | Branch Type | Deposits (000's) |
|---|---|---|---|
| Bank of Hope | 10000 Harwin Drive Houston, TX 77036 | Full Service Retail | $60,541 |
| Bank of Hope | 10147 Reseda Boulevard Northridge, CA 91324 | Full Service B&M | $168,935 |
| Bank of Hope | 1040 S. Mt. Vernon Ave. #a Colton, CA 92324 | Full Service B&M | $170,462 |
| Bank of Hope | 1100 South San Pedro Street, Unit L21-L25 Los Angeles, CA 90015 | Full Service B&M | $260,787 |
| Bank of Hope | 1102 East El Camino Real Sunnyvale, CA 94087 | Full Service B&M | $291,654 |
| Bank of Hope | 1205 South Broadway Los Angeles, CA 90015 | Full Service B&M | $275,973 |
| Bank of Hope | 1300 South San Pedro Street Los Angeles, CA 90021 | Full Service B&M | $161,990 |
| Bank of Hope | 1338 Blalock Road Houston, TX 77055 | Full Service B&M | $39,419 |
| Bank of Hope | 138-02 Northern Boulevard Flushing, NY 11354 | Full Service B&M | $217,221 |
| Bank of Hope | 13890 Braddock Road Centreville, VA 20121 | Full Service B&M | $45,005 |
| Bank of Hope | 14407 Culver Dr. Irvine, CA 92604 | Full Service B&M | $178,576 |
| Bank of Hope | 15024 Northern Blvd Flushing, NY 11354 | Full Service B&M | $45,588 |
| Bank of Hope | 16 West 32nd Street New York, NY 10001 | Full Service B&M | $532,566 |
| Bank of Hope | 1605 Eastern Boulevard Montgomery, AL 36117 | Full Service B&M | $34,247 |
| Bank of Hope | 162-05 Crocheron Ave Flushing, NY 11358 | Full Service B&M | $166,158 |
| Bank of Hope | 1645 Milwaukee Avenue Glenview, IL 60025 | Full Service B&M | $87,030 |
| Bank of Hope | 1655 West Redondo Beach Boulevard Gardena, CA 90247 | Full Service B&M | $457,490 |
| Bank of Hope | 1709 South Nogales St. Suite 100 Rowland Heights, CA 91748 | Full Service B&M | $120,930 |
| Bank of Hope | 172 Main Street Fort Lee, NJ 7024 | Full Service B&M | $199,700 |
| Bank of Hope | 17410 Highway 99, Suite 130 Lynnwood, WA 98037 | Full Service B&M | $106,114 |
| Bank of Hope | 17500 Carmenita Road Cerritos, CA 90703 | Full Service B&M | $263,653 |
| Bank of Hope | 1939 Harrison St Suite 190 Oakland, CA 94612 | Full Service B&M | $123,627 |
| Bank of Hope | 19811 Colima Road Walnut, CA 91789 | Full Service B&M | $152,606 |
| Bank of Hope | 209-07 Northern Blvd. Bayside, NY 11361 | Full Service B&M | $162,149 |
| Bank of Hope | 2222 W. Olympic Blvd. Los Angeles, CA 90006 | Full Service B&M | $658,411 |
| Bank of Hope | 2237 Royal Ln Dallas, TX 75229 | Full Service B&M | $149,422 |
| Bank of Hope | 2424 Sepulveda Blvd., #a Torrance, CA 90501 | Full Service B&M | $336,633 |
| Bank of Hope | 253 N. Western Ave. Los Angeles, CA 90005 | Full Service B&M | $121,641 |
| Bank of Hope | 2727 West Olympic Boulevard Los Angeles, CA 90006 | Full Service B&M | $392,311 |
| Bank of Hope | 2809 S. Diamond Bar Blvd. Diamond Bar, CA 91765 | Full Service B&M | $100,375 |
| Bank of Hope | 303 Broad Avenue Palisades Park, NJ 7650 | Full Service B&M | $72,400 |
| Bank of Hope | 31827-B Pacific Hwy South Federal Way, WA 98003 | Full Service B&M | $95,947 |
| Bank of Hope | 3200 Wilshire Boulevard Suite 1400 Los Angeles, CA 90010 | Full Service B&M | $3,660,762 |
| Bank of Hope | 3231 Foothill Blvd., Suite 205 La Crescenta, CA 91214 | Full Service B&M | $170,342 |
| Bank of Hope | 3267 W Olympic Blvd Los Angeles, CA 90006 | Full Service B&M | $320,006 |
| Bank of Hope | 3301 184th St Sw #125 Lynnwood, WA 98037 | Full Service B&M | $134,699 |
| Bank of Hope | 3435 Wilshire Blvd. #150 Los Angeles, CA 90010 | Full Service B&M | $156,302 |
| Bank of Hope | 3600 Wilshire Boulevard, Suite 100-A Los Angeles, CA 90010 | Full Service B&M | $316,390 |
| Bank of Hope | 3832 Wilshire Boulevard Los Angeles, CA 90010 | Full Service B&M | $318,943 |
| Bank of Hope | 401 E. 11th Street, Suite 211 Los Angeles, CA 90015 | Full Service B&M | $290,775 |
| Bank of Hope | 4428 Convoy St. #a-200 San Diego, CA 92111 | Full Service B&M | $107,528 |
| Bank of Hope | 474 Sylvan Avenue Englewood Cliffs, NJ 7632 | Full Service B&M | $126,026 |
| Bank of Hope | 485 Great Neck Rd Great Neck, NY 11021 | Limited, Drive-thru | $99,990 |
| Bank of Hope | 4875 La Palma Avenue La Palma, CA 90623 | Full Service B&M | $169,024 |
| Bank of Hope | 50-15 Roosevelt Avenue Woodside, NY 11377 | Full Service B&M | $175,776 |
| Bank of Hope | 5300 Beach Boulevard, Unit 101 Buena Park, CA 90621 | Full Service B&M | $203,349 |
| Bank of Hope | 5307 Beach Boulevard Buena Park, CA 90621 | Limited, Drive-thru | $231,483 |
| Bank of Hope | 5526 West Touhy Avenue Skokie, IL 60077 | Full Service B&M | $213,842 |
| Bank of Hope | 6350 Pacific Boulevard Huntington Park, CA 90255 | Full Service B&M | $65,144 |
| Bank of Hope | 7410-A Little River Turnpike Annandale, VA 22003 | Full Service B&M | $53,395 |
| Bank of Hope | 7553 Boulevard 26 North Richland Hills, TX 76180 | Full Service B&M | $23,729 |
| Bank of Hope | 801 Civic Center Drive, Ste. 155 Niles, IL 60714 | Full Service B&M | $59,739 |
| Bank of Hope | 83 West Golf Road Arlington Heights, IL 60005 | Full Service B&M | $155,421 |
| Bank of Hope | 8401 Reseda Boulevard Northridge, CA 91324 | Full Service B&M | $253,723 |
| Bank of Hope | 841 South Western Avenue Los Angeles, CA 90005 | Full Service B&M | $191,388 |
| Bank of Hope | 8504 Golf Road Niles, IL 60714 | Full Service B&M | $116,338 |
| Bank of Hope | 8608 South Tacoma Way Lakewood, WA 98499 | Full Service B&M | $99,610 |
| Bank of Hope | 9580 Garden Grove Boulevard, Suite 100 Garden Grove, CA 92844 | Full Service B&M | $180,680 |
For 2020, Bank Of Hope had 58 branches.
Yearly Performance Overview
Bank Income
| Item | Value (in 000's) |
|---|---|
| Total interest income | $599,371 |
| Net interest income | $482,137 |
| Total noninterest income | $39,494 |
| Gross Fiduciary activities income | $0 |
| Service charges on deposit accounts | $15,632 |
| Trading account gains and fees | $0 |
| Additional Noninterest Income | $23,862 |
| Pre-tax net operating income | $153,734 |
| Securities gains (or losses, -) | $8,019 |
| Income before extraordinary items | $125,780 |
| Discontinued Operations (Extraordinary gains, net) | $0 |
| Net income of bank and minority interests | $125,780 |
| Minority interest net income | $0 |
| Net income | $125,780 |
| Sale, conversion, retirement of capital stock, net | $6,649 |
| Net operating income | $119,444 |
Bank Of Hope's gross interest income from loans was $599,371,000.
Bank Of Hope's net interest income from loans was $482,137,000.
Bank Of Hope's fee based income from loans was $15,632,000.
Bank Of Hope's net income from loans was $125,780,000.
Bank Expenses
| Item | Value (in 000's) |
|---|---|
| Total interest expense | $117,234 |
| Provision for credit losses | $95,000 |
| Total noninterest expense | $272,897 |
| Salaries and employee benefits | $163,978 |
| Premises and equipment expense | $45,170 |
| Additional noninterest expense | $63,749 |
| Applicable income taxes | $35,973 |
| Net charge-offs | $8,603 |
| Cash dividends | $96,000 |
Bank Of Hope's interest expense for loans was $117,234,000.
Bank Of Hope's payroll and benefits expense were $163,978,000.
Bank Of Hope's property, plant and equipment expenses $45,170,000.
Loan Performance
| Type of Loan | % of Loans Noncurrent (30+ days, end of period snapshot) |
|---|---|
| All loans | 0.0% |
| Real Estate loans | 0.0% |
| Construction & Land Development loans | 6.0% |
| Nonfarm, nonresidential loans | 0.0% |
| Multifamily residential loans | 0.0% |
| 1-4 family residential loans | 0.0% |
| HELOC loans | 36.0% |
| All other family | 0.0% |
| Commercial & industrial loans | 0.0% |
| Personal loans | 0.0% |
| Credit card loans | 2.7% |
| Other individual loans | 0.0% |
| Auto loans | 0.0% |
| Other consumer loans | 0.0% |
| Unsecured commercial real estate loans | 0.0% |
Deposits
| Type | Value (in 000's) |
|---|---|
| Total deposits | $14,354,290 |
| Deposits held in domestic offices | $14,354,290 |
| Deposits by Individuals, partnerships, and corporations | $13,775,649 |
| Deposits by U.S. Government | $44 |
| Deposits by States and political subdivisions in the U.S. | $417,035 |
| Deposits by Commercial banks and other depository institutions in U.S. | $141,246 |
| Deposits by Banks in foreign countries | $20,316 |
| Deposits by Foreign governments and official institutions | $0 |
| Transaction accounts | $1,407,062 |
| Demand deposits | $1,407,062 |
| Nontransaction accounts | $12,947,228 |
| Money market deposit accounts (MMDAs) | $8,659,964 |
| Other savings deposits (excluding MMDAs) | $157,798 |
| Total time deposits | $4,129,466 |
| Total time and savings deposits | $12,947,228 |
| Noninterest-bearing deposits | $4,834,612 |
| Interest-bearing deposits | $9,519,678 |
| Retail deposits | $11,363,795 |
| IRAs and Keogh plan accounts | $209,879 |
| Brokered deposits | $1,135,534 |
| Deposits held in foreign offices | $0 |
Assets
| Asset | Value (in 000's) |
|---|---|
| Total Assets | $17,104,484 |
| Cash & Balances due from depository institutions | $443,233 |
| Interest-bearing balances | $296,302 |
| Total securities | $2,313,223 |
| Federal funds sold & reverse repurchase | $0 |
| Net loans and leases | $13,374,215 |
| Loan and leases loss allowance | $206,741 |
| Trading account assets | $0 |
| Bank premises and fixed assets | $88,102 |
| Other real estate owned | $20,121 |
| Goodwill and other intangibles | $486,850 |
| All other assets | $378,740 |
Liabilities
| Liabilities | Value (in 000's) |
|---|---|
| Total liabilities and capital | $17,104,484 |
| Total Liabilities | $14,769,148 |
| Total deposits | $14,354,290 |
| Interest-bearing deposits | $9,519,678 |
| Deposits held in domestic offices | $14,354,290 |
| % insured (estimated) | $37 |
| Federal funds purchased and repurchase agreements | $0 |
| Trading liabilities | $0 |
| Other borrowed funds | $250,000 |
| Subordinated debt | $0 |
| All other liabilities | $164,858 |
Issued Loan Types
| Type | Value (in 000's) |
|---|---|
| Net loans and leases | $13,374,215 |
| Loan and leases loss allowance | $206,741 |
| Total loans and leases (domestic) | $13,580,956 |
| All real estate loans | $9,292,625 |
| Real estate loans in domestic offices | $9,292,625 |
| Construction and development loans | $309,100 |
| Residential 1-4 family construction | $12,327 |
| Other construction, all land development and other land | $296,773 |
| Loans secured by nonfarm nonresidential properties | $7,916,990 |
| Nonfarm nonresidential secured by owner-occupied properties | $2,794,678 |
| Commercial real estate & other non-farm, non-residential | $5,122,312 |
| Multifamily residential real estate | $404,016 |
| 1-4 family residential loans | $660,973 |
| Farmland loans | $1,546 |
| Loans held in foreign offices | $0 |
| Farm loans | $0 |
| Commercial and industrial loans | $3,162,256 |
| To non-U.S. addressees | $0 |
| Loans to individuals | $42,595 |
| Credit card loans | $5,097 |
| Related Plans | $29,352 |
| Consumer Auto Loans | $4 |
| Other loans to individuals | $8,142 |
| All other loans & leases | $1,083,480 |
| Loans to foreign governments and official institutions | $0 |
| Other loans | $1,055,189 |
| Loans to depository institutions and acceptances of other banks | $0 |
| Loans not secured by real estate | $57,448 |
| Loans secured by real estate to non-U.S. addressees | $0 |
| Restructured Loans & leases | $36,797 |
| Non 1-4 family restructured loans & leases | $36,696 |
| Total loans and leases (foreign) | $0 |
Bank of Hope had $13,374,215,000 of loans outstanding in 2020. $9,292,625,000 of loans were in real estate loans. $309,100,000 of loans were in development loans. $404,016,000 of loans were in multifamily mortgage loans. $660,973,000 of loans were in 1-4 family mortgage loans. $0 of loans were in farm loans. $5,097,000 of loans were in credit card loans. $4,000 of loans were in the auto loan category.
Small Business Loans
| Categorization | # of Loans in Category | $ amount of loans (in 000's) | Average $/loan |
|---|---|---|---|
| Nonfarm, nonresidential loans - <$1MM | 2,244 | $845,677 | $376,861 |
| Nonfarm, nonresidential loans - <$100k | 11 | $500 | $45,455 |
| Nonfarm, nonresidential loans - $100-250k | 241 | $24,691 | $102,452 |
| Nonfarm, nonresidential loans - $250k-1MM | 1,992 | $820,486 | $411,891 |
| Commercial & Industrial, US addressed loans - <$1MM | 7,523 | $719,917 | $95,695 |
| Commercial & Industrial, US addressed loans - <$100k | 4,664 | $157,516 | $33,773 |
| Commercial & Industrial, US addressed loans - $100-250k | 1,628 | $191,790 | $117,807 |
| Commercial & Industrial, US addressed loans - $250k-1MM | 1,231 | $370,611 | $301,065 |