Farmers Bank & Trust Company Mortgage Rates, Fees & Info
Magnolia, ARLEI: 549300GKNMX0ZXKVPE54
Tax ID: 71-0054330
Latest/2024 | 2023 Data | 2022 Data | 2021 Data | 2020 Data | 2019 Data | 2018 Data
Jump to:
Mortgage Data
Bank Data
Review & Overview
Farmers Bank & Trust Company is a smaller bank specializing in Home Purchase and Refi loans. Farmers Bank & Trust Company has a high proportion of conventional loans. They have a low ratio of USDA loans. They have a a low proportion of FHA loans. (This may mean they shy away from first time homebuyers.) Their top markets by origination volume include: Texarkana, Paris, Magnolia, Dallas, and Little Rock among others. We have data for 38 markets. (Some data included below & more in-depth data is available with an active subscription.)Farmers Bank & Trust Company has an above average approval rate when compared to the average across all lenders. They have an above average pick rate when compared to similar lenders. Farmers Bank & Trust Company is typically a low fee lender. (We use the term "fees" to include things like closing costs and other costs incurred by borrowers-- whether they are paid out of pocket or rolled into the loan.) They typically have about average rates.
We show data for every lender and do not change our ratings-- even if an organization is a paid advertiser. Our consensus data does have lag, but it is highly correlated to a lender's rates & fees relative to their markets. This means that if a bank is a low fee/rate lender the past-- chances are they are still one today. Our SimulatedRates™ use advanced statistical techniques to forecast different rates based on a lender's historical data.
Mortgage seekers: Choose your metro area here to explore the lowest fee & rate lenders.
Mortgage professionals: We have various tools to make your lives easier. Contact us to see how we can help with your market research, analytics or advertising needs.
SimulatedRates™Mortgage Type |
Simulated Rate | Simulation Date |
|---|---|---|
| 30 Year Conventional Purchase | 7.03% | 1/25/26 |
| 30 Year Conventional Refi | 6.97% | 1/25/26 |
| 30 Year Cash-out Refi | 7.50% | 1/25/26 |
| 30 Year FHA Purchase | 7.34% | 1/25/26 |
| 30 Year FHA Refi | 7.48% | 1/25/26 |
| 30 Year VA Purchase | 7.02% | 1/25/26 |
| 30 Year VA Refi | 6.67% | 1/25/26 |
| 30 Year USDA Purchase | 7.06% | 1/25/26 |
| 15 Year Conventional Purchase | 7.70% | 1/25/26 |
| 15 Year Conventional Refi | 8.63% | 1/25/26 |
| 15 Year Cash-out Refi | 8.63% | 1/25/26 |
| These are simulated rates generated by our proprietary machine learning models. These are not guaranteed by the bank. They are our estimates based on a lender's past behaviors combined with current market conditions. Contact an individual lender for their actual rates. Our models use fixed rate terms for conforming loans, 700+ FICO, 10% down for FHA and 20% for conventional. These are based on consensus, historical data-- not advertised promotional rates. | ||
Farmers Bank & Trust Company Mortgage Calculator
Your Estimates
Estimated Loan Payment: Update the calculator values and click calculate payment!
This is not an official calculator from Farmers Bank & Trust Company. It uses our SimulatedRate™
technology, basic math and reasonable assumptions to calculate mortgage payments derived from our simulations and your inputs.
The default purchase price is the median sales price across the US for 2022Q4, per FRED.
Originations
823Origination Dollar Volume (All Markets)
$183,765,000Employee count
293Awards
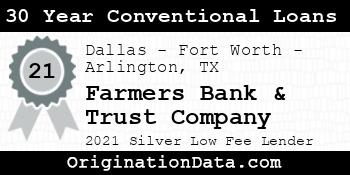


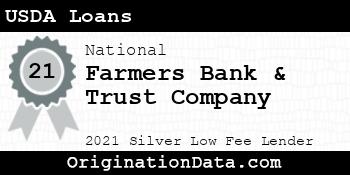
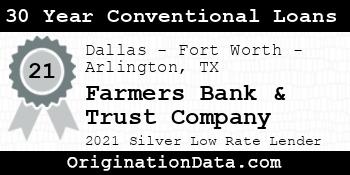
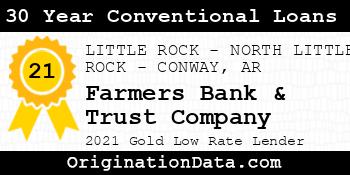

Farmers Bank & Trust Company - 2021
Farmers Bank & Trust Company is a 2021 , due to their low .
For 2021, less than of lenders were eligible for this award.
Work for Farmers Bank & Trust Company?
Use this award on your own site. Either save and use the images below, or pass the provided image embed code to your development team.
Top Markets
Zoom/scroll map to see bank's per metro statistics. Subscribers can configure state/metro/county granularity, assorted fields and quantity of results. This map shows top 10 markets in the map viewport, as defined by descending origination volume.
| Market | Originations | Total Value | Average Loan | Average Fees | Average Rate |
|---|---|---|---|---|---|
| TEXARKANA, TX-AR (FHA|USDA|VA) | 231 | $44,445,000 | $192,403 | $3,815 | 3.93% |
| Paris, TX (FHA|USDA|VA) | 133 | $27,915,000 | $209,887 | $3,489 | 3.66% |
| Magnolia, AR (FHA|USDA|VA) | 124 | $23,340,000 | $188,226 | $2,396 | 3.86% |
| Dallas-Fort Worth-Arlington, TX (FHA|USDA|VA) | 32 | $12,030,000 | $375,938 | $4,601 | 2.85% |
| Outside of Metro Areas | 52 | $11,180,000 | $215,000 | $2,819 | 3.86% |
| LITTLE ROCK-NORTH LITTLE ROCK-CONWAY, AR (FHA|USDA|VA) | 38 | $10,950,000 | $288,158 | $2,713 | 3.00% |
| HOT SPRINGS, AR (FHA|USDA|VA) | 26 | $10,550,000 | $405,769 | $2,228 | 3.99% |
| Camden, AR (FHA|USDA|VA) | 35 | $9,325,000 | $266,429 | $2,163 | 4.23% |
| Hope, AR (FHA|USDA|VA) | 69 | $6,845,000 | $99,203 | $1,598 | 4.51% |
| El Dorado, AR (FHA|USDA|VA) | 14 | $5,370,000 | $383,571 | $2,508 | 4.24% |
| DAPHNE-FAIRHOPE-FOLEY, AL (FHA|USDA|VA) | 2 | $2,750,000 | $1,375,000 | $0 | 4.10% |
| Granbury, TX (FHA|USDA|VA) | 1 | $2,325,000 | $2,325,000 | $0 | 4.00% |
| Malvern, AR (FHA|USDA|VA) | 17 | $2,285,000 | $134,412 | $2,054 | 3.86% |
| SHERMAN-DENISON, TX (FHA|USDA|VA) | 4 | $1,750,000 | $437,500 | $7,618 | 3.89% |
| FAYETTEVILLE-SPRINGDALE-ROGERS, AR (FHA|USDA|VA) | 6 | $1,720,000 | $286,667 | $3,161 | 3.67% |
| NEW ORLEANS-METAIRIE, LA (FHA|USDA|VA) | 3 | $1,675,000 | $558,333 | $4,003 | 2.96% |
| AUSTIN-ROUND ROCK-GEORGETOWN, TX (FHA|USDA|VA) | 2 | $1,220,000 | $610,000 | $0 | 3.99% |
| SHREVEPORT-BOSSIER CITY, LA (FHA|USDA|VA) | 3 | $1,115,000 | $371,667 | $4,821 | 4.21% |
| Mount Pleasant, TX (FHA|USDA|VA) | 4 | $740,000 | $185,000 | $3,980 | 3.25% |
| SANTA ROSA-PETALUMA, CA (FHA|USDA|VA) | 1 | $705,000 | $705,000 | $0 | 4.95% |
| OCALA, FL (FHA|USDA|VA) | 1 | $545,000 | $545,000 | $7,062 | 2.38% |
| LONGVIEW, TX (FHA|USDA|VA) | 1 | $525,000 | $525,000 | $6,683 | 3.25% |
| MEMPHIS, TN-MS-AR (FHA|USDA|VA) | 1 | $505,000 | $505,000 | $3,688 | 2.38% |
| North Port-Sarasota-Bradenton, FL (FHA|USDA|VA) | 1 | $485,000 | $485,000 | $5,130 | 2.88% |
| ATLANTA-SANDY SPRINGS-ALPHARETTA, GA (FHA|USDA|VA) | 1 | $355,000 | $355,000 | $4,044 | 2.75% |
| JONESBORO, AR (FHA|USDA|VA) | 2 | $340,000 | $170,000 | $2,122 | 3.25% |
| Minden, LA (FHA|USDA|VA) | 4 | $340,000 | $85,000 | $2,358 | 4.25% |
| SPOKANE-SPOKANE VALLEY, WA (FHA|USDA|VA) | 1 | $335,000 | $335,000 | $3,389 | 2.88% |
| CORPUS CHRISTI, TX (FHA|USDA|VA) | 2 | $310,000 | $155,000 | $0 | 4.75% |
| HOUSTON-THE WOODLANDS-SUGAR LAND, TX (FHA|USDA|VA) | 1 | $305,000 | $305,000 | $3,946 | 2.49% |
| Arkadelphia, AR (FHA|USDA|VA) | 3 | $285,000 | $95,000 | $1,668 | 4.17% |
| Gainesville, TX (FHA|USDA|VA) | 1 | $275,000 | $275,000 | $0 | 4.50% |
| Bonham, TX (FHA|USDA|VA) | 2 | $210,000 | $105,000 | $0 | 4.38% |
| FORT SMITH, AR-OK (FHA|USDA|VA) | 1 | $185,000 | $185,000 | $2,729 | 3.63% |
| OKLAHOMA CITY, OK (FHA|USDA|VA) | 1 | $165,000 | $165,000 | $3,446 | 2.99% |
| Kerrville, TX (FHA|USDA|VA) | 1 | $145,000 | $145,000 | $4,548 | 2.00% |
| Ruston, LA (FHA|USDA|VA) | 1 | $135,000 | $135,000 | $0 | 4.50% |
| Batesville, AR (FHA|USDA|VA) | 1 | $85,000 | $85,000 | $1,889 | 5.25% |
Similar Lenders
We use machine learning to identify the top lenders compared against Farmers Bank & Trust Company based on their rates and fees, along with other useful metrics. A lower similarity rank signals a stronger match.
Similarity Rank: 285
Similarity Rank: 540
Similarity Rank: 782
Similarity Rank: 924
Similarity Rank: 1100
Similarity Rank: 1200
Similarity Rank: 1313
Similarity Rank: 1392
Similarity Rank: 1408
Similarity Rank: 1950
Product Mix
For 2021, Farmers Bank & Trust Company's most frequently originated type of loan was Conventional, with 762 originations. Their 2nd most popular type was USDA, with 29 originations.
Loan Reason
For 2021, Farmers Bank & Trust Company's most frequently cited loan purpose was Home Purchase, with 458 originations. The 2nd most popular reason was Refi, with 256 originations.
Loan Duration/Length
For 2021, Farmers Bank & Trust Company's most frequently cited loan duration was 30 Year, with 275 originations. The 2nd most popular length was Other, with 203 originations.
Origination Fees/Closing Costs
Farmers Bank & Trust Company's average total fees were $3,792, while their most frequently occuring range of origination fees (closing costs) were in the $<1k bucket, with 521 originations.
Interest Rates
During 2021, Farmers Bank & Trust Company's average interest rate for loans was 2.96%, while their most frequently originated rate bucket for loans was 4-5%, with 296 originations.
Loan Sizing
2021 saw Farmers Bank & Trust Company place emphasis on $100k-200k loans with 265 originations, totaling $39,135,000 in origination value.
Applicant Income
Farmers Bank & Trust Company lent most frequently to those with incomes in the $100k-150k range, with 148 originations. The second most popular income band? $50k-75k, with 131 originations.
Applicant Debt to Income Ratio
Farmers Bank & Trust Company lent most frequently to those with DTI ratios of 20-30%, with 166 originations. The next most common DTI ratio? 30-36%, with 135 originations.
Ethnicity Mix
Approval Rates
Total approvals of all applications95.74%
Farmers Bank & Trust Company has an exceptionally high approval rate. They either target their audience very well or may have lax underwriting protocols.
Pick Rate
Approvals leading to origination93.56%
Farmers Bank & Trust Company has an average pick rate.
Points and Fees
| Points | Originations | Total Value | Average Loan |
|---|---|---|---|
| NA | 823 | $183,765,000 | $223,287 |
LTV Distribution
Bank Details
Branches
| Bank Name | Branch | Branch Type | Deposits (000's) |
|---|---|---|---|
| Farmers Bank & Trust Company | 1102 Arkansas Blvd Texarkana, AR 71854 | Limited, Drive-thru | $34,637 |
| Farmers Bank & Trust Company | 112 N. Hwy 229 Haskell, AR 72015 | Full Service B&M | $23,315 |
| Farmers Bank & Trust Company | 1125 Fairview Road Camden, AR 71701 | Limited, Drive-thru | $12,003 |
| Farmers Bank & Trust Company | 1128 East Main Magnolia, AR 71753 | Limited, Drive-thru | $2,062 |
| Farmers Bank & Trust Company | 1140 Washington Street, N.W. Camden, AR 71701 | Limited, Drive-thru | $21,908 |
| Farmers Bank & Trust Company | 116 Jefferson Street, S.W. Camden, AR 71701 | Full Service B&M | $166,088 |
| Farmers Bank & Trust Company | 1375 Ne Loop 286 Paris, TX 75460 | Full Service B&M | $66,795 |
| Farmers Bank & Trust Company | 15064 Highway 132 Taylor, AR 71861 | Limited, Drive-thru | $16,822 |
| Farmers Bank & Trust Company | 1606 Hollensworth Street Magnolia, AR 71753 | Limited, Drive-thru | $39 |
| Farmers Bank & Trust Company | 1929 Oliver Lancaster Blvd. Malvern, AR 72104 | Full Service B&M | $8,098 |
| Farmers Bank & Trust Company | 200 East Main Street Magnolia, AR 71753 | Full Service B&M | $410,583 |
| Farmers Bank & Trust Company | 201 East Third Street Hope, AR 71801 | Full Service B&M | $135,070 |
| Farmers Bank & Trust Company | 205 East Main Magnolia, AR 71753 | Limited, Drive-thru | $0 |
| Farmers Bank & Trust Company | 2106 North Jackson Magnolia, AR 71753 | Limited, Drive-thru | $4,224 |
| Farmers Bank & Trust Company | 217 E. Union St. Magnolia, AR 71753 | Limited, Trust Office | $0 |
| Farmers Bank & Trust Company | 220 E Main Magnolia, AR 71753 | Limited, Administrative | $0 |
| Farmers Bank & Trust Company | 222 Pine Street Magnolia, AR 71753 | Limited, Administrative | $0 |
| Farmers Bank & Trust Company | 2900 St. Michael Drive Texarkana, TX 75503 | Full Service B&M | $251,140 |
| Farmers Bank & Trust Company | 3345 Highway 5 North, Ste 100 Bryant, AR 72019 | Full Service B&M | $11,518 |
| Farmers Bank & Trust Company | 3601 East 9th Street Texarkana, AR 71854 | Full Service B&M | $33,582 |
| Farmers Bank & Trust Company | 416 North Mccoy Blvd New Boston, TX 75570 | Full Service B&M | $98,670 |
| Farmers Bank & Trust Company | 419 West 1st Street Lewisville, AR 71845 | Limited, Drive-thru | $13,319 |
| Farmers Bank & Trust Company | 521 East Page Malvern, AR 72104 | Full Service B&M | $68,082 |
| Farmers Bank & Trust Company | 5461 Highway 371 Blevins, AR 71825 | Limited, Drive-thru | $10,226 |
| Farmers Bank & Trust Company | 5600 Richmond Road Texarkana, TX 75503 | Full Service B&M | $53,034 |
| Farmers Bank & Trust Company | 617 North Hervey Hope, AR 71801 | Limited, Drive-thru | $7,983 |
| Farmers Bank & Trust Company | 750 North Preston Rd Prosper, TX 75078 | Full Service B&M | $160,502 |
| Farmers Bank & Trust Company | East 2nd And Main Streets Prescott, AR 71857 | Full Service B&M | $60,171 |
For 2021, Farmers Bank & Trust Company had 28 branches.
Yearly Performance Overview
Bank Income
| Item | Value (in 000's) |
|---|---|
| Total interest income | $78,978 |
| Net interest income | $70,839 |
| Total noninterest income | $13,915 |
| Gross Fiduciary activities income | $893 |
| Service charges on deposit accounts | $4,524 |
| Trading account gains and fees | $0 |
| Additional Noninterest Income | $8,498 |
| Pre-tax net operating income | $36,113 |
| Securities gains (or losses, -) | $-111 |
| Income before extraordinary items | $28,568 |
| Discontinued Operations (Extraordinary gains, net) | $0 |
| Net income of bank and minority interests | $28,568 |
| Minority interest net income | $0 |
| Net income | $28,568 |
| Sale, conversion, retirement of capital stock, net | $0 |
| Net operating income | $28,655 |
Farmers Bank & Trust Company's gross interest income from loans was $78,978,000.
Farmers Bank & Trust Company's net interest income from loans was $70,839,000.
Farmers Bank & Trust Company's fee based income from loans was $4,524,000.
Farmers Bank & Trust Company's net income from loans was $28,568,000.
Bank Expenses
| Item | Value (in 000's) |
|---|---|
| Total interest expense | $8,139 |
| Provision for credit losses | $4,400 |
| Total noninterest expense | $44,241 |
| Salaries and employee benefits | $24,189 |
| Premises and equipment expense | $5,492 |
| Additional noninterest expense | $14,560 |
| Applicable income taxes | $7,434 |
| Net charge-offs | $2,859 |
| Cash dividends | $6,000 |
Farmers Bank & Trust Company's interest expense for loans was $8,139,000.
Farmers Bank & Trust Company's payroll and benefits expense were $24,189,000.
Farmers Bank & Trust Company's property, plant and equipment expenses $5,492,000.
Loan Performance
| Type of Loan | % of Loans Noncurrent (30+ days, end of period snapshot) |
|---|---|
| All loans | 0.0% |
| Real Estate loans | 0.0% |
| Construction & Land Development loans | 0.0% |
| Nonfarm, nonresidential loans | 0.0% |
| Multifamily residential loans | 0.0% |
| 1-4 family residential loans | 0.0% |
| HELOC loans | 0.0% |
| All other family | 0.0% |
| Commercial & industrial loans | 1.0% |
| Personal loans | 0.0% |
| Credit card loans | 0.6% |
| Other individual loans | 0.0% |
| Auto loans | 1.0% |
| Other consumer loans | 0.0% |
| Unsecured commercial real estate loans | 0.0% |
Deposits
| Type | Value (in 000's) |
|---|---|
| Total deposits | $1,834,435 |
| Deposits held in domestic offices | $1,834,435 |
| Deposits by Individuals, partnerships, and corporations | $1,249,716 |
| Deposits by U.S. Government | $0 |
| Deposits by States and political subdivisions in the U.S. | $584,719 |
| Deposits by Commercial banks and other depository institutions in U.S. | $0 |
| Deposits by Banks in foreign countries | $0 |
| Deposits by Foreign governments and official institutions | $0 |
| Transaction accounts | $744,287 |
| Demand deposits | $445,452 |
| Nontransaction accounts | $1,090,148 |
| Money market deposit accounts (MMDAs) | $497,104 |
| Other savings deposits (excluding MMDAs) | $114,721 |
| Total time deposits | $478,324 |
| Total time and savings deposits | $1,388,983 |
| Noninterest-bearing deposits | $380,168 |
| Interest-bearing deposits | $1,454,267 |
| Retail deposits | $1,618,913 |
| IRAs and Keogh plan accounts | $44,101 |
| Brokered deposits | $8,407 |
| Deposits held in foreign offices | $0 |
Assets
| Asset | Value (in 000's) |
|---|---|
| Total Assets | $2,106,370 |
| Cash & Balances due from depository institutions | $53,112 |
| Interest-bearing balances | $26,413 |
| Total securities | $519,850 |
| Federal funds sold & reverse repurchase | $0 |
| Net loans and leases | $1,411,146 |
| Loan and leases loss allowance | $24,402 |
| Trading account assets | $0 |
| Bank premises and fixed assets | $40,593 |
| Other real estate owned | $47 |
| Goodwill and other intangibles | $24,299 |
| All other assets | $57,323 |
Liabilities
| Liabilities | Value (in 000's) |
|---|---|
| Total liabilities and capital | $2,106,370 |
| Total Liabilities | $1,895,897 |
| Total deposits | $1,834,435 |
| Interest-bearing deposits | $1,454,267 |
| Deposits held in domestic offices | $1,834,435 |
| % insured (estimated) | $90 |
| Federal funds purchased and repurchase agreements | $0 |
| Trading liabilities | $0 |
| Other borrowed funds | $46,300 |
| Subordinated debt | $0 |
| All other liabilities | $15,162 |
Issued Loan Types
| Type | Value (in 000's) |
|---|---|
| Net loans and leases | $1,411,146 |
| Loan and leases loss allowance | $24,402 |
| Total loans and leases (domestic) | $1,435,548 |
| All real estate loans | $1,131,798 |
| Real estate loans in domestic offices | $1,131,798 |
| Construction and development loans | $175,870 |
| Residential 1-4 family construction | $21,801 |
| Other construction, all land development and other land | $154,069 |
| Loans secured by nonfarm nonresidential properties | $569,142 |
| Nonfarm nonresidential secured by owner-occupied properties | $193,730 |
| Commercial real estate & other non-farm, non-residential | $375,412 |
| Multifamily residential real estate | $27,152 |
| 1-4 family residential loans | $274,920 |
| Farmland loans | $84,714 |
| Loans held in foreign offices | $0 |
| Farm loans | $17,994 |
| Commercial and industrial loans | $257,421 |
| To non-U.S. addressees | $0 |
| Loans to individuals | $23,162 |
| Credit card loans | $1,867 |
| Related Plans | $0 |
| Consumer Auto Loans | $6,942 |
| Other loans to individuals | $14,353 |
| All other loans & leases | $5,173 |
| Loans to foreign governments and official institutions | $0 |
| Other loans | $579 |
| Loans to depository institutions and acceptances of other banks | $0 |
| Loans not secured by real estate | $0 |
| Loans secured by real estate to non-U.S. addressees | $0 |
| Restructured Loans & leases | $41 |
| Non 1-4 family restructured loans & leases | $0 |
| Total loans and leases (foreign) | $0 |
Farmers Bank & Trust Company had $1,411,146,000 of loans outstanding in 2021. $1,131,798,000 of loans were in real estate loans. $175,870,000 of loans were in development loans. $27,152,000 of loans were in multifamily mortgage loans. $274,920,000 of loans were in 1-4 family mortgage loans. $17,994,000 of loans were in farm loans. $1,867,000 of loans were in credit card loans. $6,942,000 of loans were in the auto loan category.
Small Business Loans
| Categorization | # of Loans in Category | $ amount of loans (in 000's) | Average $/loan |
|---|---|---|---|
| Nonfarm, nonresidential loans - <$1MM | 490 | $86,811 | $177,165 |
| Nonfarm, nonresidential loans - <$100k | 157 | $6,170 | $39,299 |
| Nonfarm, nonresidential loans - $100-250k | 153 | $18,066 | $118,078 |
| Nonfarm, nonresidential loans - $250k-1MM | 180 | $62,575 | $347,639 |
| Commercial & Industrial, US addressed loans - <$1MM | 2,438 | $140,937 | $57,808 |
| Commercial & Industrial, US addressed loans - <$100k | 1,851 | $41,221 | $22,270 |
| Commercial & Industrial, US addressed loans - $100-250k | 395 | $38,179 | $96,656 |
| Commercial & Industrial, US addressed loans - $250k-1MM | 192 | $61,537 | $320,505 |
| Farmland loans - <$1MM | 266 | $24,250 | $91,165 |
| Farmland loans - <$100k | 155 | $5,462 | $35,239 |
| Farmland loans - $100-250k | 76 | $9,017 | $118,645 |
| Farmland loans - $250k-1MM | 35 | $9,771 | $279,171 |
| Agriculture operations loans - <$1MM | 246 | $8,414 | $34,203 |
| Agriculture operations loans - <$100k | 218 | $4,153 | $19,050 |
| Agriculture operations loans - $100-250k | 19 | $2,067 | $108,789 |
| Agriculture operations loans - $250k-1MM | 9 | $2,194 | $243,778 |