First Bank Mortgage Rates, Fees & Info
Southern Pines, NCLEI: 254900L67A0ZTJRS6614
Tax ID: 56-0132230
Latest/2024 | 2023 Data | 2022 Data | 2021 Data | 2020 Data | 2019 Data | 2018 Data
Jump to:
Mortgage Data
Bank Data
Review & Overview
First Bank is a smaller bank specializing in Home Purchase loans. First Bank has a high proportion of conventional loans. They have a a low proportion of FHA loans. (This may mean they shy away from first time homebuyers.) They have a low ratio of USDA loans. Their top markets by origination volume include: Asheville, Wilmington, Myrtle Beach, Greensboro, and Charlotte among others. We have data for 47 markets. (Some data included below & more in-depth data is available with an active subscription.)First Bank has an average approval rate when compared to the average across all lenders. They have a below average pick rate when compared to similar lenders. First Bank is typically a low fee lender. (We use the term "fees" to include things like closing costs and other costs incurred by borrowers-- whether they are paid out of pocket or rolled into the loan.) They typically have about average rates.
We show data for every lender and do not change our ratings-- even if an organization is a paid advertiser. Our consensus data does have lag, but it is highly correlated to a lender's rates & fees relative to their markets. This means that if a bank is a low fee/rate lender the past-- chances are they are still one today. Our SimulatedRates™ use advanced statistical techniques to forecast different rates based on a lender's historical data.
Mortgage seekers: Choose your metro area here to explore the lowest fee & rate lenders.
Mortgage professionals: We have various tools to make your lives easier. Contact us to see how we can help with your market research, analytics or advertising needs.
SimulatedRates™Mortgage Type |
Simulated Rate | Simulation Date |
|---|---|---|
| Home Equity Line of Credit (HELOC) | 6.88% | 2/8/26 |
| 30 Year Conventional Purchase | 4.91% | 2/8/26 |
| 30 Year Conventional Refi | 6.47% | 2/8/26 |
| 30 Year Cash-out Refi | 6.74% | 2/8/26 |
| 30 Year FHA Purchase | 6.67% | 2/8/26 |
| 30 Year FHA Refi | 6.60% | 2/8/26 |
| 30 Year VA Purchase | 6.52% | 2/8/26 |
| 30 Year USDA Purchase | 6.08% | 2/8/26 |
| These are simulated rates generated by our proprietary machine learning models. These are not guaranteed by the bank. They are our estimates based on a lender's past behaviors combined with current market conditions. Contact an individual lender for their actual rates. Our models use fixed rate terms for conforming loans, 700+ FICO, 10% down for FHA and 20% for conventional. These are based on consensus, historical data-- not advertised promotional rates. | ||
First Bank Mortgage Calculator
Your Estimates
Estimated Loan Payment: Update the calculator values and click calculate payment!
This is not an official calculator from First Bank. It uses our SimulatedRate™
technology, basic math and reasonable assumptions to calculate mortgage payments derived from our simulations and your inputs.
The default purchase price is the median sales price across the US for 2022Q4, per FRED.
Originations
2,375Origination Dollar Volume (All Markets)
$551,905,000Employee count
1,142Awards


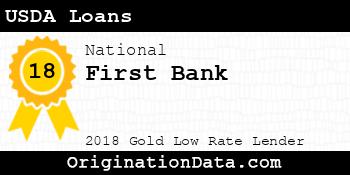
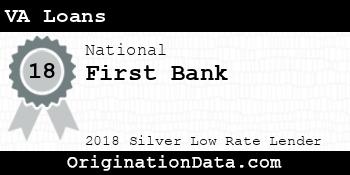
First Bank - 2018
First Bank is a 2018 , due to their low .
For 2018, less than of lenders were eligible for this award.
Work for First Bank?
Use this award on your own site. Either save and use the images below, or pass the provided image embed code to your development team.
Top Markets
Zoom/scroll map to see bank's per metro statistics. Subscribers can configure state/metro/county granularity, assorted fields and quantity of results. This map shows top 10 markets in the map viewport, as defined by descending origination volume.
| Market | Originations | Total Value | Average Loan | Average Fees | Average Rate |
|---|---|---|---|---|---|
| ASHEVILLE, NC (FHA|USDA|VA) | 354 | $80,710,000 | $227,994 | $5,737 | 4.53% |
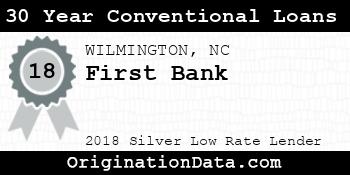
| WILMINGTON, NC (FHA|USDA|VA) | 183 | $58,895,000 | $321,831 | $6,023 | 4.77% |
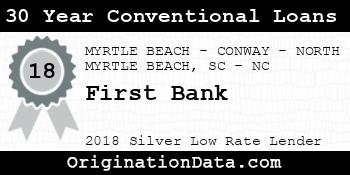
| MYRTLE BEACH-CONWAY-NORTH MYRTLE BEACH, SC-NC (FHA|USDA|VA) | 204 | $54,600,000 | $267,647 | $5,547 | 4.62% |
| GREENSBORO-HIGH POINT, NC (FHA|USDA|VA) | 190 | $37,630,000 | $198,053 | $5,041 | 4.69% |
| CHARLOTTE-CONCORD-GASTONIA, NC-SC (FHA|USDA|VA) | 135 | $35,745,000 | $264,778 | $5,782 | 4.63% |
| Outside of Metro Areas | 248 | $32,440,000 | $130,806 | $5,011 | 5.01% |
| BURLINGTON, NC (FHA|USDA|VA) | 61 | $30,135,000 | $494,016 | $4,456 | 4.45% |
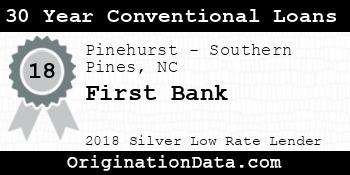
| Pinehurst-Southern Pines, NC (FHA|USDA|VA) | 166 | $29,620,000 | $178,434 | $5,300 | 4.81% |
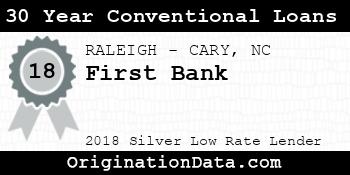
| RALEIGH-CARY, NC (FHA|USDA|VA) | 64 | $20,800,000 | $325,000 | $6,269 | 4.59% |
| FAYETTEVILLE, NC (FHA|USDA|VA) | 87 | $17,625,000 | $202,586 | $5,641 | 4.72% |
| WINSTON-SALEM, NC (FHA|USDA|VA) | 96 | $15,440,000 | $160,833 | $4,448 | 4.68% |
| Washington, NC (FHA|USDA|VA) | 80 | $12,490,000 | $156,125 | $3,988 | 4.76% |
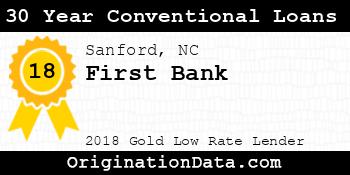
| Sanford, NC (FHA|USDA|VA) | 86 | $12,180,000 | $141,628 | $5,075 | 4.78% |
| DURHAM-CHAPEL HILL, NC (FHA|USDA|VA) | 48 | $11,240,000 | $234,167 | $4,998 | 4.64% |
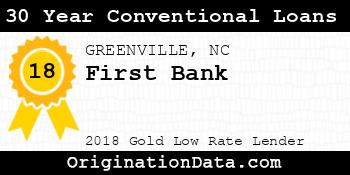
| GREENVILLE, NC (FHA|USDA|VA) | 47 | $9,935,000 | $211,383 | $5,248 | 4.76% |
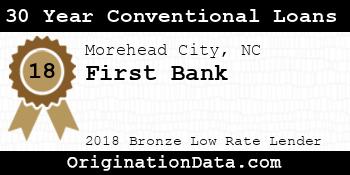
| Morehead City, NC (FHA|USDA|VA) | 32 | $9,220,000 | $288,125 | $5,529 | 4.78% |
| FLORENCE, SC (FHA|USDA|VA) | 34 | $8,780,000 | $258,235 | $6,395 | 4.57% |
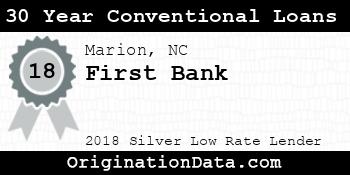
| Marion, NC (FHA|USDA|VA) | 47 | $8,765,000 | $186,489 | $4,911 | 4.44% |
| Albemarle, NC (FHA|USDA|VA) | 51 | $7,985,000 | $156,569 | $6,264 | 4.78% |
| GOLDSBORO, NC (FHA|USDA|VA) | 1 | $7,005,000 | $7,005,000 | $0 | 6.00% |
| Kinston, NC (FHA|USDA|VA) | 1 | $6,105,000 | $6,105,000 | $0 | 5.00% |
| STAUNTON, VA (FHA|USDA|VA) | 1 | $5,105,000 | $5,105,000 | $0 | 5.00% |
| JACKSONVILLE, NC (FHA|USDA|VA) | 27 | $4,635,000 | $171,667 | $5,496 | 5.58% |
| CHARLESTON-NORTH CHARLESTON, SC (FHA|USDA|VA) | 3 | $4,365,000 | $1,455,000 | $5,633 | 4.44% |
| Kill Devil Hills, NC (FHA|USDA|VA) | 16 | $4,140,000 | $258,750 | $6,269 | 5.24% |
| HICKORY-LENOIR-MORGANTON, NC (FHA|USDA|VA) | 13 | $4,015,000 | $308,846 | $6,729 | 4.17% |
| Brevard, NC (FHA|USDA|VA) | 16 | $3,600,000 | $225,000 | $5,714 | 4.14% |
| Newberry, SC (FHA|USDA|VA) | 1 | $3,505,000 | $3,505,000 | $0 | 4.75% |
| LYNCHBURG, VA (FHA|USDA|VA) | 1 | $2,405,000 | $2,405,000 | $0 | 5.00% |
| VIRGINIA BEACH-NORFOLK-NEWPORT NEWS, VA-NC (FHA|USDA|VA) | 3 | $1,965,000 | $655,000 | $0 | 4.82% |
| Lumberton, NC (FHA|USDA|VA) | 20 | $1,880,000 | $94,000 | $4,535 | 4.88% |
| Rockingham, NC (FHA|USDA|VA) | 17 | $1,735,000 | $102,059 | $4,510 | 5.01% |
| Laurinburg, NC (FHA|USDA|VA) | 16 | $1,610,000 | $100,625 | $3,611 | 5.07% |
| Boone, NC (FHA|USDA|VA) | 4 | $1,120,000 | $280,000 | $4,020 | 4.53% |
| Forest City, NC (FHA|USDA|VA) | 1 | $815,000 | $815,000 | $8,790 | 4.50% |
| NEW BERN, NC (FHA|USDA|VA) | 5 | $795,000 | $159,000 | $4,427 | 4.48% |
| PUNTA GORDA, FL (FHA|USDA|VA) | 1 | $605,000 | $605,000 | $0 | 5.75% |
| GREENVILLE-ANDERSON, SC (FHA|USDA|VA) | 3 | $415,000 | $138,333 | $4,469 | 4.96% |
| North Wilkesboro, NC (FHA|USDA|VA) | 2 | $390,000 | $195,000 | $2,549 | 5.69% |
| Cullowhee, NC (FHA|USDA|VA) | 2 | $270,000 | $135,000 | $4,555 | 4.56% |
| Seneca, SC (FHA|USDA|VA) | 1 | $255,000 | $255,000 | $5,545 | 4.00% |
| Bennettsville, SC (FHA|USDA|VA) | 2 | $230,000 | $115,000 | $0 | 5.88% |
| Georgetown, SC (FHA|USDA|VA) | 1 | $205,000 | $205,000 | $5,454 | 5.13% |
| Wilson, NC (FHA|USDA|VA) | 1 | $185,000 | $185,000 | $2,510 | 4.63% |
| SPARTANBURG, SC (FHA|USDA|VA) | 1 | $155,000 | $155,000 | $3,361 | 4.50% |
| SUMTER, SC (FHA|USDA|VA) | 1 | $105,000 | $105,000 | $0 | 5.50% |
| Roanoke Rapids, NC (FHA|USDA|VA) | 1 | $55,000 | $55,000 | $0 | 5.00% |
Similar Lenders
We use machine learning to identify the top lenders compared against First Bank based on their rates and fees, along with other useful metrics. A lower similarity rank signals a stronger match.
Similarity Rank: 258
Similarity Rank: 390
Similarity Rank: 423
Similarity Rank: 567
Similarity Rank: 572
Similarity Rank: 602
Similarity Rank: 645
Similarity Rank: 738
Similarity Rank: 756
Similarity Rank: 884
Product Mix
For 2018, First Bank's most frequently originated type of loan was Conventional, with 1,348 originations. Their 2nd most popular type was HELOC, with 898 originations.
Loan Reason
For 2018, First Bank's most frequently cited loan purpose was Home Purchase, with 1,242 originations. The 2nd most popular reason was Other, with 518 originations.
Loan Duration/Length
For 2018, First Bank's most frequently cited loan duration was 15 Year, with 874 originations. The 2nd most popular length was 30 Year, with 716 originations.
Origination Fees/Closing Costs
First Bank's average total fees were $4,743, while their most frequently occuring range of origination fees (closing costs) were in the $3k-4k bucket, with 282 originations.
Interest Rates
During 2018, First Bank's average interest rate for loans was 4.41%, while their most frequently originated rate bucket for loans was 4-5%, with 1,573 originations.
Loan Sizing
2018 saw First Bank place emphasis on $100,000 or less loans with 709 originations, totaling $41,115,000 in origination value.
Applicant Income
First Bank lent most frequently to those with incomes in the $100k-150k range, with 525 originations. The second most popular income band? $50k-75k, with 447 originations.
Applicant Debt to Income Ratio
First Bank lent most frequently to those with DTI ratios of 20-30%, with 571 originations. The next most common DTI ratio? 30-36%, with 461 originations.
Ethnicity Mix
Approval Rates
Total approvals of all applications86.18%
First Bank has an average approval rate.
Pick Rate
Approvals leading to origination87.24%
First Bank has an average pick rate.
Points and Fees
| Points | Originations | Total Value | Average Loan |
|---|---|---|---|
| NA | 2,375 | $551,905,000 | $232,381 |
Occupancy Type Mix
LTV Distribution
Complaints
| Bank Name | Product | Issue | 2018 CPFB Complaints | % of Total Issues |
|---|---|---|---|---|
| FIRSTBANK | Conventional home mortgage | Closing on a mortgage | 1 | 33.3% |
| FIRSTBANK | Other type of mortgage | Trouble during payment process | 1 | 33.3% |
| FIRSTBANK | Home equity loan or line of credit (HELOC) | Trouble during payment process | 1 | 33.3% |
Bank Details
Branches
| Bank Name | Branch | Branch Type | Deposits (000's) |
|---|---|---|---|
| First Bank | 10 Chinquapin Rd Pinehurst, NC 28374 | Full Service B&M | $43,972 |
| First Bank | 10 South Tunnel Road Asheville, NC 28805 | Full Service B&M | $44,445 |
| First Bank | 10 Waterford Business Center Way Belville, NC 28451 | Full Service B&M | $67,961 |
| First Bank | 100 East Leitner Street Latta, SC 29565 | Full Service B&M | $28,761 |
| First Bank | 100 Waters Dr Southern Pines, NC 28387 | Full Service B&M | $18,014 |
| First Bank | 1000 South Main Street Lillington, NC 27546 | Full Service B&M | $87,941 |
| First Bank | 101 North Spring Street Greensboro, NC 27401 | Full Service B&M | $176,408 |
| First Bank | 101 West Main Street Dillon, SC 29536 | Full Service B&M | $35,379 |
| First Bank | 1012 Patton Avenue Asheville, NC 28806 | Full Service B&M | $75,968 |
| First Bank | 102 East Fifth Street Tabor City, NC 28463 | Full Service B&M | $16,898 |
| First Bank | 104 National Drive Biscoe, NC 27209 | Full Service B&M | $31,741 |
| First Bank | 1040 Albemarle Road Troy, NC 27371 | Full Service B&M | $107,517 |
| First Bank | 105 North Main Street Mars Hill, NC 28754 | Full Service B&M | $40,062 |
| First Bank | 105 S. Sandhill Boulevard Aberdeen, NC 28315 | Full Service B&M | $24,316 |
| First Bank | 108 N. Middleton St. Robbins, NC 27325 | Full Service B&M | $41,058 |
| First Bank | 108 Tobacco Drive Wallace, NC 28466 | Full Service B&M | $48,725 |
| First Bank | 109 Monroe Street Carthage, NC 28327 | Full Service B&M | $32,122 |
| First Bank | 109 Penny Road High Point, NC 27260 | Limited, Drive-thru | $1,644 |
| First Bank | 11 Church Street Asheville, NC 28801 | Full Service B&M | $151,941 |
| First Bank | 1104 North J K Powell Boulevard Whiteville, NC 28472 | Full Service B&M | $28,424 |
| First Bank | 114 West Main Street Locust, NC 28097 | Full Service B&M | $34,589 |
| First Bank | 11410 N Main Street Archdale, NC 27263 | Full Service B&M | $12,780 |
| First Bank | 1200 North Main Street High Point, NC 27262 | Full Service B&M | $31,237 |
| First Bank | 1201 East Arlington Blvd Greenville, NC 27858 | Full Service B&M | $15,747 |
| First Bank | 121 West Main Street Seagrove, NC 27341 | Full Service B&M | $30,126 |
| First Bank | 1254 E. Broad Avenue Rockingham, NC 28379 | Full Service B&M | $53,349 |
| First Bank | 1333 Plaza Boulevard Sanford, NC 27330 | Full Service B&M | $112,612 |
| First Bank | 135 Highway 49 North Richfield, NC 28137 | Full Service B&M | $26,048 |
| First Bank | 135 North Main Street Fuquay Varina, NC 27526 | Full Service B&M | $15,504 |
| First Bank | 137 Highway 24 Morehead City, NC 28557 | Full Service B&M | $31,248 |
| First Bank | 1503 Live Oak Street Beaufort, NC 28516 | Full Service B&M | $12,039 |
| First Bank | 1525 Jake Alexander Boulevard South Salisbury, NC 28146 | Full Service B&M | $55,137 |
| First Bank | 1554 North Peace Haven Road Winston Salem, NC 27104 | Full Service B&M | $16,895 |
| First Bank | 1601 Highwoods Boulevard Greensboro, NC 27410 | Full Service B&M | $52,119 |
| First Bank | 162 North Main Street Marion, NC 28752 | Full Service B&M | $56,929 |
| First Bank | 1701 Eastwood Road Wilmington, NC 28403 | Full Service B&M | $59,288 |
| First Bank | 17948 Hwy 109 S. Denton, NC 27239 | Full Service B&M | $78,284 |
| First Bank | 18 Chatham Corner Pittsboro, NC 27312 | Full Service B&M | $28,741 |
| First Bank | 1879 Hendersonville Road Asheville, NC 28803 | Full Service B&M | $71,148 |
| First Bank | 1910 East Main Street Albemarle, NC 28001 | Full Service B&M | $22,618 |
| First Bank | 2 Market Street Brevard, NC 28712 | Full Service B&M | $24,621 |
| First Bank | 200 Seaboard Street Vass, NC 28394 | Full Service B&M | $26,184 |
| First Bank | 2007 S. Croatan Hwy Kill Devil Hills, NC 27948 | Full Service B&M | $19,042 |
| First Bank | 201 Kennedy Road Thomasville, NC 27360 | Full Service B&M | $42,066 |
| First Bank | 201 Market Street Wilmington, NC 28401 | Full Service B&M | $46,675 |
| First Bank | 205 Se Broad Street Southern Pines, NC 28387 | Full Service B&M | $182,148 |
| First Bank | 205 South Main Street Kenansville, NC 28349 | Full Service B&M | $52,037 |
| First Bank | 206 East Monroe Street Dillon, SC 29536 | Limited, Drive-thru | $2,663 |
| First Bank | 210 West 3rd Street Pembroke, NC 28372 | Full Service B&M | $52,342 |
| First Bank | 2170 West Evans Street Florence, SC 29501 | Full Service B&M | $38,203 |
| First Bank | 229 North Main Street Broadway, NC 27505 | Full Service B&M | $47,519 |
| First Bank | 2317 Highway 52 North Albemarle, NC 28001 | Full Service B&M | $21,335 |
| First Bank | 232 W. Broad Street Elizabethtown, NC 28337 | Full Service B&M | $28,271 |
| First Bank | 2604 Lawndale Drive Greensboro, NC 27408 | Full Service B&M | $111,204 |
| First Bank | 2630 South Horner Blvd Sanford, NC 27332 | Full Service B&M | $35,251 |
| First Bank | 2801 North Elm Street Lumberton, NC 28358 | Full Service B&M | $82,720 |
| First Bank | 2939 Village Drive Fayetteville, NC 28304 | Full Service B&M | $19,620 |
| First Bank | 300 S.W. Broad Street Southern Pines, NC 28387 | Full Service B&M | $289,549 |
| First Bank | 300 W State Street Black Mountain, NC 28711 | Full Service B&M | $64,569 |
| First Bank | 301 South Main Street Fairmont, NC 28340 | Full Service B&M | $30,284 |
| First Bank | 301 West Broad Street St. Pauls, NC 28384 | Full Service B&M | $27,434 |
| First Bank | 3110 Edwards Mill Road Raleigh, NC 27612 | Full Service B&M | $9,115 |
| First Bank | 3210 Ray Road Spring Lake, NC 28390 | Full Service B&M | $17,020 |
| First Bank | 3214 S. Church St. Burlington, NC 27215 | Full Service B&M | $52,645 |
| First Bank | 335 S. Fayetteville Street Asheboro, NC 27203 | Full Service B&M | $98,312 |
| First Bank | 3364 Harmony Highway Harmony, NC 28634 | Full Service B&M | $23,505 |
| First Bank | 347 North Main Street Mooresville, NC 28115 | Full Service B&M | $37,537 |
| First Bank | 347 Whiteville Road, Nw Shallotte, NC 28470 | Full Service B&M | $43,129 |
| First Bank | 3551 Hendersonville Road Fletcher, NC 28732 | Full Service B&M | $19,011 |
| First Bank | 3605 Oleander Drive Wilmington, NC 28403 | Full Service B&M | $22,998 |
| First Bank | 3948 Chatham Street Bennett, NC 27208 | Full Service B&M | $16,521 |
| First Bank | 401 Gilead Road Huntersville, NC 28078 | Full Service B&M | $8,388 |
| First Bank | 401 Knollwood Street Winston Salem, NC 27103 | Full Service B&M | $24,211 |
| First Bank | 4010 Brian Jordan Place High Point, NC 27265 | Full Service B&M | $35,448 |
| First Bank | 402 East Williams Street Apex, NC 27502 | Full Service B&M | $28,703 |
| First Bank | 402 S. Second Avenue Mayodan, NC 27027 | Full Service B&M | $24,705 |
| First Bank | 405 S. Sycamore Street Rose Hill, NC 28458 | Full Service B&M | $31,950 |
| First Bank | 4110 Western Boulevard Jacksonville, NC 28546 | Full Service B&M | $54,158 |
| First Bank | 415 North Raleigh Street Angier, NC 27501 | Full Service B&M | $25,288 |
| First Bank | 4201 Congress Street, Suite 100 Charlotte, NC 28209 | Full Service B&M | $21,301 |
| First Bank | 421 South Main Street Kannapolis, NC 28081 | Full Service B&M | $23,534 |
| First Bank | 4295 Nc Hwy 211 West End, NC 27376 | Full Service B&M | $56,835 |
| First Bank | 452 Second Loop Rd Florence, SC 29505 | Full Service B&M | $16,639 |
| First Bank | 46 Pinecrest Plaza Southern Pines, NC 28387 | Full Service B&M | $56,306 |
| First Bank | 5 Blake Blvd Pinehurst, NC 28374 | Full Service B&M | $34,014 |
| First Bank | 5 Olde Eastwood Village Blvd Asheville, NC 28803 | Full Service B&M | $35,960 |
| First Bank | 5002 Peters Creek Parkway Winston Salem, NC 27127 | Full Service B&M | $9,838 |
| First Bank | 5102 South College Road Wilmington, NC 28412 | Full Service B&M | $51,435 |
| First Bank | 5210 Southport-Supply Rd Southport, NC 28461 | Full Service B&M | $14,692 |
| First Bank | 553 East Plaza Drive Mooresville, NC 28115 | Full Service B&M | $11,749 |
| First Bank | 5610 University Parkway Winston Salem, NC 27105 | Full Service B&M | $7,222 |
| First Bank | 601 North Main Street Hendersonville, NC 28792 | Full Service B&M | $46,352 |
| First Bank | 601 South Main Street Laurinburg, NC 28352 | Full Service B&M | $78,706 |
| First Bank | 6303 Beach Drive Southwest Ocean Isle Beach, NC 28469 | Full Service B&M | $58,467 |
| First Bank | 639 West 15th Street Washington, NC 27889 | Full Service B&M | $46,009 |
| First Bank | 770 W Main St Belhaven, NC 27810 | Full Service B&M | $13,173 |
| First Bank | 778 Merrimon Ave Asheville, NC 28804 | Full Service B&M | $59,362 |
| First Bank | 7996 Us Hwy 74 West Polkton, NC 28135 | Full Service B&M | $15,180 |
| First Bank | 8252 Highway 49 North Mount Pleasant, NC 28124 | Full Service B&M | $23,804 |
| First Bank | 827 New Bridge Street Jacksonville, NC 28540 | Full Service B&M | $29,599 |
| First Bank | 8286 Market Street Wilmington, NC 28411 | Full Service B&M | $28,792 |
| First Bank | 901 Chesterfield Highway Cheraw, SC 29520 | Full Service B&M | $44,255 |
| First Bank | 907 Smoky Park Highway Candler, NC 28715 | Full Service B&M | $41,171 |
For 2018, First Bank had 103 branches.
Yearly Performance Overview
Bank Income
| Item | Value (in 000's) |
|---|---|
| Total interest income | $231,164 |
| Net interest income | $209,885 |
| Total noninterest income | $62,112 |
| Gross Fiduciary activities income | $0 |
| Service charges on deposit accounts | $12,690 |
| Trading account gains and fees | $0 |
| Additional Noninterest Income | $49,422 |
| Pre-tax net operating income | $117,638 |
| Securities gains (or losses, -) | $0 |
| Income before extraordinary items | $92,575 |
| Discontinued Operations (Extraordinary gains, net) | $0 |
| Net income of bank and minority interests | $92,575 |
| Minority interest net income | $0 |
| Net income | $92,575 |
| Sale, conversion, retirement of capital stock, net | $0 |
| Net operating income | $92,575 |
First Bank's gross interest income from loans was $231,164,000.
First Bank's net interest income from loans was $209,885,000.
First Bank's fee based income from loans was $12,690,000.
First Bank's net income from loans was $92,575,000.
Bank Expenses
| Item | Value (in 000's) |
|---|---|
| Total interest expense | $21,279 |
| Provision for credit losses | $-3,589 |
| Total noninterest expense | $157,948 |
| Salaries and employee benefits | $91,730 |
| Premises and equipment expense | $16,135 |
| Additional noninterest expense | $50,083 |
| Applicable income taxes | $25,063 |
| Net charge-offs | $-1,330 |
| Cash dividends | $15,525 |
First Bank's interest expense for loans was $21,279,000.
First Bank's payroll and benefits expense were $91,730,000.
First Bank's property, plant and equipment expenses $16,135,000.
Loan Performance
| Type of Loan | % of Loans Noncurrent (30+ days, end of period snapshot) |
|---|---|
| All loans | 0.0% |
| Real Estate loans | 0.0% |
| Construction & Land Development loans | 0.0% |
| Nonfarm, nonresidential loans | 0.0% |
| Multifamily residential loans | 0.0% |
| 1-4 family residential loans | 0.0% |
| HELOC loans | 0.0% |
| All other family | 0.0% |
| Commercial & industrial loans | 0.0% |
| Personal loans | 0.0% |
| Credit card loans | 0.4% |
| Other individual loans | 0.0% |
| Auto loans | 0.0% |
| Other consumer loans | 0.0% |
| Unsecured commercial real estate loans | 0.0% |
Deposits
| Type | Value (in 000's) |
|---|---|
| Total deposits | $4,665,855 |
| Deposits held in domestic offices | $4,665,855 |
| Deposits by Individuals, partnerships, and corporations | $4,196,430 |
| Deposits by U.S. Government | $0 |
| Deposits by States and political subdivisions in the U.S. | $465,997 |
| Deposits by Commercial banks and other depository institutions in U.S. | $3,428 |
| Deposits by Banks in foreign countries | $0 |
| Deposits by Foreign governments and official institutions | $0 |
| Transaction accounts | $73,575 |
| Demand deposits | $52,619 |
| Nontransaction accounts | $4,592,280 |
| Money market deposit accounts (MMDAs) | $1,035,523 |
| Other savings deposits (excluding MMDAs) | $2,601,809 |
| Total time deposits | $954,949 |
| Total time and savings deposits | $4,613,236 |
| Noninterest-bearing deposits | $1,326,621 |
| Interest-bearing deposits | $3,339,234 |
| Retail deposits | $4,163,105 |
| IRAs and Keogh plan accounts | $106,880 |
| Brokered deposits | $239,875 |
| Deposits held in foreign offices | $0 |
Assets
| Asset | Value (in 000's) |
|---|---|
| Total Assets | $5,865,282 |
| Cash & Balances due from depository institutions | $463,235 |
| Interest-bearing balances | $335,801 |
| Total securities | $602,588 |
| Federal funds sold & reverse repurchase | $0 |
| Net loans and leases | $4,232,906 |
| Loan and leases loss allowance | $21,039 |
| Trading account assets | $0 |
| Bank premises and fixed assets | $118,993 |
| Other real estate owned | $7,440 |
| Goodwill and other intangibles | $257,411 |
| All other assets | $182,709 |
Liabilities
| Liabilities | Value (in 000's) |
|---|---|
| Total liabilities and capital | $5,865,282 |
| Total Liabilities | $5,048,634 |
| Total deposits | $4,665,855 |
| Interest-bearing deposits | $3,339,234 |
| Deposits held in domestic offices | $4,665,855 |
| % insured (estimated) | $67 |
| Federal funds purchased and repurchase agreements | $0 |
| Trading liabilities | $0 |
| Other borrowed funds | $352,707 |
| Subordinated debt | $0 |
| All other liabilities | $30,072 |
Issued Loan Types
| Type | Value (in 000's) |
|---|---|
| Net loans and leases | $4,232,906 |
| Loan and leases loss allowance | $21,039 |
| Total loans and leases (domestic) | $4,253,945 |
| All real estate loans | $3,724,914 |
| Real estate loans in domestic offices | $3,724,914 |
| Construction and development loans | $518,976 |
| Residential 1-4 family construction | $159,191 |
| Other construction, all land development and other land | $359,785 |
| Loans secured by nonfarm nonresidential properties | $1,575,007 |
| Nonfarm nonresidential secured by owner-occupied properties | $793,191 |
| Commercial real estate & other non-farm, non-residential | $781,816 |
| Multifamily residential real estate | $172,010 |
| 1-4 family residential loans | $1,418,916 |
| Farmland loans | $40,005 |
| Loans held in foreign offices | $0 |
| Farm loans | $7,206 |
| Commercial and industrial loans | $285,422 |
| To non-U.S. addressees | $0 |
| Loans to individuals | $71,392 |
| Credit card loans | $26,471 |
| Related Plans | $12,538 |
| Consumer Auto Loans | $13,112 |
| Other loans to individuals | $19,271 |
| All other loans & leases | $165,011 |
| Loans to foreign governments and official institutions | $0 |
| Other loans | $18,008 |
| Loans to depository institutions and acceptances of other banks | $0 |
| Loans not secured by real estate | $0 |
| Loans secured by real estate to non-U.S. addressees | $0 |
| Restructured Loans & leases | $12,774 |
| Non 1-4 family restructured loans & leases | $4,605 |
| Total loans and leases (foreign) | $0 |
First Bank had $4,232,906,000 of loans outstanding in 2018. $3,724,914,000 of loans were in real estate loans. $518,976,000 of loans were in development loans. $172,010,000 of loans were in multifamily mortgage loans. $1,418,916,000 of loans were in 1-4 family mortgage loans. $7,206,000 of loans were in farm loans. $26,471,000 of loans were in credit card loans. $13,112,000 of loans were in the auto loan category.
Small Business Loans
| Categorization | # of Loans in Category | $ amount of loans (in 000's) | Average $/loan |
|---|---|---|---|
| Nonfarm, nonresidential loans - <$1MM | 2,811 | $644,586 | $229,308 |
| Nonfarm, nonresidential loans - <$100k | 514 | $23,296 | $45,323 |
| Nonfarm, nonresidential loans - $100-250k | 1,049 | $131,718 | $125,565 |
| Nonfarm, nonresidential loans - $250k-1MM | 1,248 | $489,572 | $392,285 |
| Commercial & Industrial, US addressed loans - <$1MM | 2,668 | $225,990 | $84,704 |
| Commercial & Industrial, US addressed loans - <$100k | 1,852 | $49,837 | $26,910 |
| Commercial & Industrial, US addressed loans - $100-250k | 433 | $47,487 | $109,670 |
| Commercial & Industrial, US addressed loans - $250k-1MM | 383 | $128,666 | $335,943 |
| Farmland loans - <$1MM | 191 | $21,658 | $113,393 |
| Farmland loans - <$100k | 88 | $3,801 | $43,193 |
| Farmland loans - $100-250k | 60 | $7,401 | $123,350 |
| Farmland loans - $250k-1MM | 43 | $10,456 | $243,163 |
| Agriculture operations loans - <$1MM | 68 | $3,650 | $53,676 |
| Agriculture operations loans - <$100k | 55 | $1,584 | $28,800 |
| Agriculture operations loans - $100-250k | 8 | $668 | $83,500 |
| Agriculture operations loans - $250k-1MM | 5 | $1,398 | $279,600 |