Progress Bank And Trust Mortgage Rates, Fees & Info
Huntsville, ALLEI: 549300E2RDLPC5BL1Z93
Tax ID: 26-1740755
Latest/2024 | 2023 Data | 2022 Data | 2021 Data | 2020 Data | 2019 Data | 2018 Data
Jump to:
Mortgage Data
Bank Data
Review & Overview
Progress Bank And Trust is a smaller bank specializing in Home Purchase and Refi loans. Progress Bank And Trust has a high proportion of conventional loans. They have a a low proportion of FHA loans. (This may mean they shy away from first time homebuyers.) They have a low ratio of USDA loans. Their top markets by origination volume include: Huntsville, Crestview, Birmingham, Florence, and Decatur among others. We have data for 54 markets. (Some data included below & more in-depth data is available with an active subscription.)Progress Bank And Trust has an above average approval rate when compared to the average across all lenders. They have a below average pick rate when compared to similar lenders. Progress Bank And Trust is typically a low fee lender. (We use the term "fees" to include things like closing costs and other costs incurred by borrowers-- whether they are paid out of pocket or rolled into the loan.) They typically have about average rates.
We show data for every lender and do not change our ratings-- even if an organization is a paid advertiser. Our consensus data does have lag, but it is highly correlated to a lender's rates & fees relative to their markets. This means that if a bank is a low fee/rate lender the past-- chances are they are still one today. Our SimulatedRates™ use advanced statistical techniques to forecast different rates based on a lender's historical data.
Mortgage seekers: Choose your metro area here to explore the lowest fee & rate lenders.
Mortgage professionals: We have various tools to make your lives easier. Contact us to see how we can help with your market research, analytics or advertising needs.
Originations
1,902Origination Dollar Volume (All Markets)
$532,500,000Employee count
212Awards
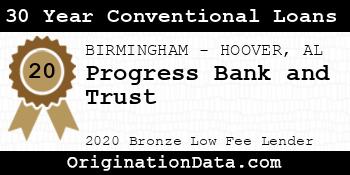

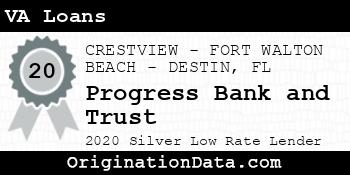


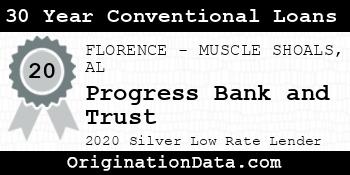
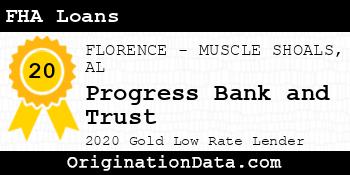


Progress Bank and Trust - 2020
Progress Bank and Trust is a 2020 , due to their low .
For 2020, less than of lenders were eligible for this award.
Work for Progress Bank and Trust?
Use this award on your own site. Either save and use the images below, or pass the provided image embed code to your development team.
Top Markets
Zoom/scroll map to see bank's per metro statistics. Subscribers can configure state/metro/county granularity, assorted fields and quantity of results. This map shows top 10 markets in the map viewport, as defined by descending origination volume.
| Market | Originations | Total Value | Average Loan | Average Fees | Average Rate |
|---|---|---|---|---|---|
| HUNTSVILLE, AL (FHA|USDA|VA) | 799 | $195,955,000 | $245,250 | $4,420 | 2.91% |
| CRESTVIEW-FORT WALTON BEACH-DESTIN, FL (FHA|USDA|VA) | 313 | $130,225,000 | $416,054 | $6,285 | 3.34% |
| BIRMINGHAM-HOOVER, AL (FHA|USDA|VA) | 223 | $64,245,000 | $288,094 | $3,166 | 3.13% |
| FLORENCE-MUSCLE SHOALS, AL (FHA|USDA|VA) | 226 | $52,120,000 | $230,619 | $3,746 | 2.94% |
| DECATUR, AL (FHA|USDA|VA) | 130 | $26,150,000 | $201,154 | $4,138 | 2.93% |
| PENSACOLA-FERRY PASS-BRENT, FL (FHA|USDA|VA) | 40 | $12,450,000 | $311,250 | $5,531 | 3.27% |
| Outside of Metro Areas | 18 | $6,960,000 | $386,667 | $3,920 | 3.56% |
| PANAMA CITY, FL (FHA|USDA|VA) | 21 | $5,575,000 | $265,476 | $6,922 | 3.98% |
| ATLANTA-SANDY SPRINGS-ALPHARETTA, GA (FHA|USDA|VA) | 15 | $4,915,000 | $327,667 | $4,231 | 2.92% |
| Albertville, AL (FHA|USDA|VA) | 14 | $3,630,000 | $259,286 | $4,631 | 2.88% |
| NASHVILLE-DAVIDSON-MURFREESBORO-FRANKLIN, TN (FHA|USDA|VA) | 12 | $2,920,000 | $243,333 | $3,877 | 2.75% |
| MONTGOMERY, AL (FHA|USDA|VA) | 9 | $2,545,000 | $282,778 | $3,555 | 2.57% |
| Cullman, AL (FHA|USDA|VA) | 7 | $2,415,000 | $345,000 | $3,814 | 2.68% |
| DAPHNE-FAIRHOPE-FOLEY, AL (FHA|USDA|VA) | 7 | $2,335,000 | $333,571 | $3,842 | 2.63% |
| Scottsboro, AL (FHA|USDA|VA) | 9 | $2,275,000 | $252,778 | $4,123 | 3.10% |
| AUGUSTA-RICHMOND COUNTY, GA-SC (FHA|USDA|VA) | 1 | $2,215,000 | $2,215,000 | $0 | 4.00% |
| TUSCALOOSA, AL (FHA|USDA|VA) | 5 | $1,055,000 | $211,000 | $3,298 | 3.13% |
| MEMPHIS, TN-MS-AR (FHA|USDA|VA) | 2 | $860,000 | $430,000 | $3,270 | 3.06% |
| PALM BAY-MELBOURNE-TITUSVILLE, FL (FHA|USDA|VA) | 3 | $785,000 | $261,667 | $3,138 | 2.71% |
| SPRINGFIELD, MO (FHA|USDA|VA) | 3 | $725,000 | $241,667 | $2,802 | 3.13% |
| NAPLES-MARCO ISLAND, FL (FHA|USDA|VA) | 2 | $670,000 | $335,000 | $7,418 | 3.50% |
| Pinehurst-Southern Pines, NC (FHA|USDA|VA) | 2 | $660,000 | $330,000 | $4,357 | 2.56% |
| TAMPA-ST. PETERSBURG-CLEARWATER, FL (FHA|USDA|VA) | 1 | $655,000 | $655,000 | $10,112 | 3.13% |
| CHARLOTTE-CONCORD-GASTONIA, NC-SC (FHA|USDA|VA) | 2 | $650,000 | $325,000 | $3,739 | 3.13% |
| AUBURN-OPELIKA, AL (FHA|USDA|VA) | 3 | $575,000 | $191,667 | $6,097 | 3.50% |
| Tullahoma-Manchester, TN (FHA|USDA|VA) | 2 | $560,000 | $280,000 | $2,693 | 2.88% |
| COLORADO SPRINGS, CO (FHA|USDA|VA) | 2 | $550,000 | $275,000 | $0 | 4.00% |
| DOTHAN, AL (FHA|USDA|VA) | 2 | $500,000 | $250,000 | $2,947 | 2.63% |
| LOUISVILLE, KY (FHA|USDA|VA) | 1 | $495,000 | $495,000 | $4,116 | 3.25% |
| CHATTANOOGA, TN-GA (FHA|USDA|VA) | 2 | $490,000 | $245,000 | $2,792 | 2.31% |
| NEW ORLEANS-METAIRIE, LA (FHA|USDA|VA) | 1 | $465,000 | $465,000 | $2,354 | 2.63% |
| RALEIGH-CARY, NC (FHA|USDA|VA) | 1 | $395,000 | $395,000 | $4,018 | 2.63% |
| ST. LOUIS, MO-IL (FHA|USDA|VA) | 2 | $390,000 | $195,000 | $3,798 | 3.56% |
| Washington-Arlington-Alexandria, DC-VA-MD-WV (FHA|USDA|VA) | 1 | $375,000 | $375,000 | $6,532 | 3.25% |
| JACKSON, MS (FHA|USDA|VA) | 1 | $355,000 | $355,000 | $3,745 | 3.63% |
| Alexander City, AL (FHA|USDA|VA) | 1 | $355,000 | $355,000 | $3,293 | 2.63% |
| Summerville, GA (FHA|USDA|VA) | 1 | $345,000 | $345,000 | $5,717 | 4.62% |
| GADSDEN, AL (FHA|USDA|VA) | 1 | $345,000 | $345,000 | $14,390 | 2.25% |
| WARNER ROBINS, GA (FHA|USDA|VA) | 1 | $335,000 | $335,000 | $6,826 | 2.38% |
| Miami-Fort Lauderdale-Pompano Beach, FL (FHA|USDA|VA) | 1 | $325,000 | $325,000 | $12,210 | 3.50% |
| SAVANNAH, GA (FHA|USDA|VA) | 1 | $305,000 | $305,000 | $2,506 | 2.63% |
| CAPE CORAL-FORT MYERS, FL (FHA|USDA|VA) | 1 | $305,000 | $305,000 | $2,755 | 2.50% |
| DURHAM-CHAPEL HILL, NC (FHA|USDA|VA) | 1 | $275,000 | $275,000 | $0 | 3.50% |
| GREENVILLE, NC (FHA|USDA|VA) | 1 | $265,000 | $265,000 | $2,929 | 3.00% |
| DELTONA-DAYTONA BEACH-ORMOND BEACH, FL (FHA|USDA|VA) | 1 | $255,000 | $255,000 | $3,625 | 2.63% |
| MANHATTAN, KS (FHA|USDA|VA) | 1 | $225,000 | $225,000 | $0 | 2.88% |
| Oxford, MS (FHA|USDA|VA) | 1 | $165,000 | $165,000 | $4,277 | 2.13% |
| ANNISTON-OXFORD, AL (FHA|USDA|VA) | 1 | $155,000 | $155,000 | $4,993 | 2.75% |
| Corinth, MS (FHA|USDA|VA) | 1 | $145,000 | $145,000 | $4,085 | 4.62% |
| Camden, AR (FHA|USDA|VA) | 1 | $135,000 | $135,000 | $2,906 | 3.00% |
| Jasper, AL (FHA|USDA|VA) | 1 | $135,000 | $135,000 | $2,243 | 3.25% |
| Talladega-Sylacauga, AL (FHA|USDA|VA) | 1 | $125,000 | $125,000 | $3,039 | 3.13% |
| MOBILE, AL (FHA|USDA|VA) | 2 | $90,000 | $45,000 | $0 | 5.25% |
| Ozark, AL (FHA|USDA|VA) | 1 | $75,000 | $75,000 | $2,533 | 2.88% |
Similar Lenders
We use machine learning to identify the top lenders compared against Progress Bank and Trust based on their rates and fees, along with other useful metrics. A lower similarity rank signals a stronger match.
Similarity Rank: 72
Similarity Rank: 156
Similarity Rank: 260
Similarity Rank: 264
Similarity Rank: 430
Similarity Rank: 464
Similarity Rank: 576
Similarity Rank: 630
Similarity Rank: 702
Similarity Rank: 702
Product Mix
For 2020, Progress Bank And Trust's most frequently originated type of loan was Conventional, with 1,555 originations. Their 2nd most popular type was VA, with 255 originations.
Loan Reason
For 2020, Progress Bank And Trust's most frequently cited loan purpose was Home Purchase, with 1,002 originations. The 2nd most popular reason was Refi, with 845 originations.
Loan Duration/Length
For 2020, Progress Bank And Trust's most frequently cited loan duration was 30 Year, with 1,478 originations. The 2nd most popular length was 15 Year, with 233 originations.
Origination Fees/Closing Costs
Progress Bank And Trust's average total fees were $4,640, while their most frequently occuring range of origination fees (closing costs) were in the $<1k bucket, with 771 originations.
Interest Rates
During 2020, Progress Bank And Trust's average interest rate for loans was 3.03%, while their most frequently originated rate bucket for loans was 2.5-3%, with 752 originations.
Loan Sizing
2020 saw Progress Bank And Trust place emphasis on $200k-400k loans with 924 originations, totaling $261,780,000 in origination value.
Applicant Income
Progress Bank And Trust lent most frequently to those with incomes in the $100k-150k range, with 455 originations. The second most popular income band? $150k-250k, with 304 originations.
Applicant Debt to Income Ratio
Progress Bank And Trust lent most frequently to those with DTI ratios of 20-30%, with 480 originations. The next most common DTI ratio? 30-36%, with 318 originations.
Ethnicity Mix
Approval Rates
Total approvals of all applications99.47%
Progress Bank And Trust has an exceptionally high approval rate. They either target their audience very well or may have lax underwriting protocols.
Pick Rate
Approvals leading to origination81.97%
Progress Bank And Trust has a below average pick rate.
Points and Fees
| Points | Originations | Total Value | Average Loan |
|---|---|---|---|
| NA | 1,902 | $532,500,000 | $279,968 |
Occupancy Type Mix
LTV Distribution
Bank Details
Branches
| Bank Name | Branch | Branch Type | Deposits (000's) |
|---|---|---|---|
| Progress Bank and Trust | 255 Grant Street Decatur, AL 35601 | Full Service B&M | $220,700 |
| Progress Bank and Trust | 12805 Us Highway 98 E, Unit A100 Inlet Beach, FL 32461 | Full Service B&M | $35,985 |
| Progress Bank and Trust | 1360 Montgomery Highway Birmingham, AL 35216 | Full Service B&M | $77,551 |
| Progress Bank and Trust | 201 Williams Avenue Huntsville, AL 35801 | Full Service B&M | $497,139 |
| Progress Bank and Trust | 2121 Highland Avenue South Birmingham, AL 35205 | Full Service B&M | $143,321 |
| Progress Bank and Trust | 230 East Tennessee Street Florence, AL 35630 | Full Service B&M | $144,000 |
| Progress Bank and Trust | 2746 Carl T. Jones Drive Huntsville, AL 35802 | Full Service B&M | $62,972 |
| Progress Bank and Trust | 35008 Emerald Coast Parkway Destin, FL 32541 | Full Service B&M | $30,507 |
| Progress Bank and Trust | 8337 Highway 72 Madison, AL 35758 | Full Service B&M | $77,580 |
For 2020, Progress Bank And Trust had 9 branches.
Yearly Performance Overview
Bank Income
| Item | Value (in 000's) |
|---|---|
| Total interest income | $58,097 |
| Net interest income | $48,010 |
| Total noninterest income | $17,650 |
| Gross Fiduciary activities income | $0 |
| Service charges on deposit accounts | $478 |
| Trading account gains and fees | $690 |
| Additional Noninterest Income | $16,482 |
| Pre-tax net operating income | $22,337 |
| Securities gains (or losses, -) | $480 |
| Income before extraordinary items | $17,675 |
| Discontinued Operations (Extraordinary gains, net) | $0 |
| Net income of bank and minority interests | $17,675 |
| Minority interest net income | $0 |
| Net income | $17,675 |
| Sale, conversion, retirement of capital stock, net | $443 |
| Net operating income | $17,295 |
Progress Bank And Trust's gross interest income from loans was $58,097,000.
Progress Bank And Trust's net interest income from loans was $48,010,000.
Progress Bank And Trust's fee based income from loans was $478,000.
Progress Bank And Trust's net income from loans was $17,675,000.
Bank Expenses
| Item | Value (in 000's) |
|---|---|
| Total interest expense | $10,087 |
| Provision for credit losses | $4,015 |
| Total noninterest expense | $39,308 |
| Salaries and employee benefits | $27,876 |
| Premises and equipment expense | $3,971 |
| Additional noninterest expense | $7,461 |
| Applicable income taxes | $5,142 |
| Net charge-offs | $303 |
| Cash dividends | $9,564 |
Progress Bank And Trust's interest expense for loans was $10,087,000.
Progress Bank And Trust's payroll and benefits expense were $27,876,000.
Progress Bank And Trust's property, plant and equipment expenses $3,971,000.
Loan Performance
| Type of Loan | % of Loans Noncurrent (30+ days, end of period snapshot) |
|---|---|
| All loans | 0.0% |
| Real Estate loans | 0.0% |
| Construction & Land Development loans | 0.0% |
| Nonfarm, nonresidential loans | 0.0% |
| Multifamily residential loans | 0.0% |
| 1-4 family residential loans | 0.0% |
| HELOC loans | 0.0% |
| All other family | 0.0% |
| Commercial & industrial loans | 0.0% |
| Personal loans | 0.0% |
| Credit card loans | 0.0% |
| Other individual loans | 0.0% |
| Auto loans | 0.0% |
| Other consumer loans | 0.0% |
| Unsecured commercial real estate loans | 0.0% |
Deposits
| Type | Value (in 000's) |
|---|---|
| Total deposits | $1,398,197 |
| Deposits held in domestic offices | $1,398,197 |
| Deposits by Individuals, partnerships, and corporations | $1,273,105 |
| Deposits by U.S. Government | $0 |
| Deposits by States and political subdivisions in the U.S. | $122,815 |
| Deposits by Commercial banks and other depository institutions in U.S. | $2,277 |
| Deposits by Banks in foreign countries | $0 |
| Deposits by Foreign governments and official institutions | $0 |
| Transaction accounts | $547,346 |
| Demand deposits | $547,346 |
| Nontransaction accounts | $850,851 |
| Money market deposit accounts (MMDAs) | $558,781 |
| Other savings deposits (excluding MMDAs) | $14,033 |
| Total time deposits | $278,037 |
| Total time and savings deposits | $850,851 |
| Noninterest-bearing deposits | $299,236 |
| Interest-bearing deposits | $1,098,961 |
| Retail deposits | $1,243,061 |
| IRAs and Keogh plan accounts | $15,791 |
| Brokered deposits | $103,412 |
| Deposits held in foreign offices | $0 |
Assets
| Asset | Value (in 000's) |
|---|---|
| Total Assets | $1,579,238 |
| Cash & Balances due from depository institutions | $12,679 |
| Interest-bearing balances | $334 |
| Total securities | $55,674 |
| Federal funds sold & reverse repurchase | $210,148 |
| Net loans and leases | $1,218,739 |
| Loan and leases loss allowance | $12,022 |
| Trading account assets | $2,801 |
| Bank premises and fixed assets | $13,831 |
| Other real estate owned | $0 |
| Goodwill and other intangibles | $18,797 |
| All other assets | $46,569 |
Liabilities
| Liabilities | Value (in 000's) |
|---|---|
| Total liabilities and capital | $1,579,238 |
| Total Liabilities | $1,413,387 |
| Total deposits | $1,398,197 |
| Interest-bearing deposits | $1,098,961 |
| Deposits held in domestic offices | $1,398,197 |
| % insured (estimated) | $51 |
| Federal funds purchased and repurchase agreements | $9,226 |
| Trading liabilities | $2,801 |
| Other borrowed funds | $0 |
| Subordinated debt | $0 |
| All other liabilities | $3,163 |
Issued Loan Types
| Type | Value (in 000's) |
|---|---|
| Net loans and leases | $1,218,739 |
| Loan and leases loss allowance | $12,022 |
| Total loans and leases (domestic) | $1,230,761 |
| All real estate loans | $870,561 |
| Real estate loans in domestic offices | $870,561 |
| Construction and development loans | $139,317 |
| Residential 1-4 family construction | $50,743 |
| Other construction, all land development and other land | $88,574 |
| Loans secured by nonfarm nonresidential properties | $418,496 |
| Nonfarm nonresidential secured by owner-occupied properties | $230,092 |
| Commercial real estate & other non-farm, non-residential | $188,404 |
| Multifamily residential real estate | $23,599 |
| 1-4 family residential loans | $286,535 |
| Farmland loans | $2,614 |
| Loans held in foreign offices | $0 |
| Farm loans | $334 |
| Commercial and industrial loans | $324,990 |
| To non-U.S. addressees | $0 |
| Loans to individuals | $18,826 |
| Credit card loans | $0 |
| Related Plans | $10,150 |
| Consumer Auto Loans | $1,099 |
| Other loans to individuals | $7,577 |
| All other loans & leases | $16,050 |
| Loans to foreign governments and official institutions | $0 |
| Other loans | $46 |
| Loans to depository institutions and acceptances of other banks | $0 |
| Loans not secured by real estate | $0 |
| Loans secured by real estate to non-U.S. addressees | $0 |
| Restructured Loans & leases | $3,275 |
| Non 1-4 family restructured loans & leases | $3,275 |
| Total loans and leases (foreign) | $0 |
Progress Bank and Trust had $1,218,739,000 of loans outstanding in 2020. $870,561,000 of loans were in real estate loans. $139,317,000 of loans were in development loans. $23,599,000 of loans were in multifamily mortgage loans. $286,535,000 of loans were in 1-4 family mortgage loans. $334,000 of loans were in farm loans. $0 of loans were in credit card loans. $1,099,000 of loans were in the auto loan category.
Small Business Loans
| Categorization | # of Loans in Category | $ amount of loans (in 000's) | Average $/loan |
|---|---|---|---|
| Nonfarm, nonresidential loans - <$1MM | 339 | $110,895 | $327,124 |
| Nonfarm, nonresidential loans - <$100k | 35 | $1,715 | $49,000 |
| Nonfarm, nonresidential loans - $100-250k | 94 | $14,117 | $150,181 |
| Nonfarm, nonresidential loans - $250k-1MM | 210 | $95,063 | $452,681 |
| Commercial & Industrial, US addressed loans - <$1MM | 2,276 | $162,854 | $71,553 |
| Commercial & Industrial, US addressed loans - <$100k | 1,617 | $37,951 | $23,470 |
| Commercial & Industrial, US addressed loans - $100-250k | 367 | $39,355 | $107,234 |
| Commercial & Industrial, US addressed loans - $250k-1MM | 292 | $85,548 | $292,973 |
| Farmland loans - <$1MM | 18 | $2,612 | $145,111 |
| Farmland loans - <$100k | 4 | $167 | $41,750 |
| Farmland loans - $100-250k | 7 | $921 | $131,571 |
| Farmland loans - $250k-1MM | 7 | $1,524 | $217,714 |
| Agriculture operations loans - <$1MM | 1 | $334 | $334,000 |
| Agriculture operations loans - $250k-1MM | 1 | $334 | $334,000 |