Cnb Bank Mortgage Rates, Fees & Info
Clearfield, PALEI: 549300NBFK4GO76FTE84
Tax ID: 25-0422340
Latest/2024 | 2023 Data | 2022 Data | 2021 Data | 2020 Data | 2019 Data | 2018 Data
Jump to:
Mortgage Data
Bank Data
Review & Overview
Cnb Bank is a smaller bank specializing in Home Purchase and Refi loans. Cnb Bank has a high proportion of conventional loans. Their top markets by origination volume include: Erie, Buffalo, Dubois, Columbus, and Cleveland among others. We have data for 64 markets. (Some data included below & more in-depth data is available with an active subscription.)Cnb Bank has an average approval rate when compared to the average across all lenders. They have a below average pick rate when compared to similar lenders. Cnb Bank is typically a low fee lender. (We use the term "fees" to include things like closing costs and other costs incurred by borrowers-- whether they are paid out of pocket or rolled into the loan.) They typically have about average rates.
We show data for every lender and do not change our ratings-- even if an organization is a paid advertiser. Our consensus data does have lag, but it is highly correlated to a lender's rates & fees relative to their markets. This means that if a bank is a low fee/rate lender the past-- chances are they are still one today. Our SimulatedRates™ use advanced statistical techniques to forecast different rates based on a lender's historical data.
Mortgage seekers: Choose your metro area here to explore the lowest fee & rate lenders.
Mortgage professionals: We have various tools to make your lives easier. Contact us to see how we can help with your market research, analytics or advertising needs.
SimulatedRates™Mortgage Type |
Simulated Rate | Simulation Date |
|---|---|---|
| Home Equity Line of Credit (HELOC) | 6.77% | 7/18/26 |
| 30 Year Conventional Purchase | 6.45% | 7/18/26 |
| 30 Year Conventional Refi | 6.66% | 7/18/26 |
| 30 Year Cash-out Refi | 6.27% | 7/18/26 |
| 15 Year Conventional Purchase | 6.33% | 7/18/26 |
| 15 Year Conventional Refi | 6.85% | 7/18/26 |
| 15 Year Cash-out Refi | 6.85% | 7/18/26 |
| These are simulated rates generated by our proprietary machine learning models. These are not guaranteed by the bank. They are our estimates based on a lender's past behaviors combined with current market conditions. Contact an individual lender for their actual rates. Our models use fixed rate terms for conforming loans, 700+ FICO, 10% down for FHA and 20% for conventional. These are based on consensus, historical data-- not advertised promotional rates. | ||
Cnb Bank Mortgage Calculator
Your Estimates
Estimated Loan Payment: Update the calculator values and click calculate payment!
This is not an official calculator from Cnb Bank. It uses our SimulatedRate™
technology, basic math and reasonable assumptions to calculate mortgage payments derived from our simulations and your inputs.
The default purchase price is the median sales price across the US for 2022Q4, per FRED.
Originations
1,890Origination Dollar Volume (All Markets)
$348,190,000Employee count
583Awards

CNB Bank - 2019
CNB Bank is a 2019 , due to their low .
For 2019, less than of lenders were eligible for this award.
Work for CNB Bank?
Use this award on your own site. Either save and use the images below, or pass the provided image embed code to your development team.
Top Markets
Zoom/scroll map to see bank's per metro statistics. Subscribers can configure state/metro/county granularity, assorted fields and quantity of results. This map shows top 10 markets in the map viewport, as defined by descending origination volume.
| Market | Originations | Total Value | Average Loan | Average Fees | Average Rate |
|---|---|---|---|---|---|
| ERIE, PA (FHA|USDA|VA) | 269 | $65,575,000 | $243,773 | $1,788 | 4.71% |
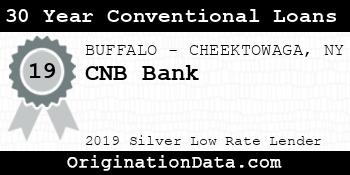
| BUFFALO-CHEEKTOWAGA, NY (FHA|USDA|VA) | 150 | $52,710,000 | $351,400 | $1,567 | 4.91% |
| DuBois, PA (FHA|USDA|VA) | 381 | $38,335,000 | $100,617 | $1,349 | 4.79% |
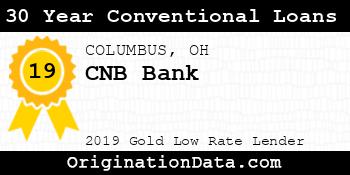
| COLUMBUS, OH (FHA|USDA|VA) | 170 | $34,730,000 | $204,294 | $1,692 | 4.69% |
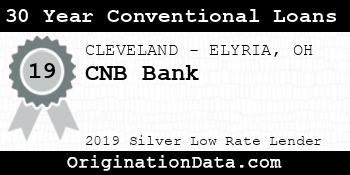
| CLEVELAND-ELYRIA, OH (FHA|USDA|VA) | 83 | $32,295,000 | $389,096 | $3,012 | 4.82% |
| DAYTON-KETTERING, OH (FHA|USDA|VA) | 2 | $20,570,000 | $10,285,000 | $323 | 4.85% |
| Meadville, PA (FHA|USDA|VA) | 145 | $13,355,000 | $92,103 | $1,560 | 4.72% |
| St. Marys, PA (FHA|USDA|VA) | 135 | $13,135,000 | $97,296 | $1,229 | 4.80% |
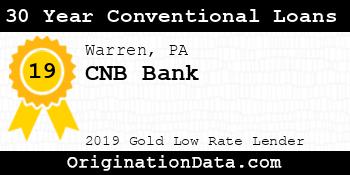
| Warren, PA (FHA|USDA|VA) | 108 | $9,230,000 | $85,463 | $1,714 | 4.95% |
| Bradford, PA (FHA|USDA|VA) | 99 | $8,755,000 | $88,434 | $1,508 | 4.98% |
| STATE COLLEGE, PA (FHA|USDA|VA) | 66 | $8,610,000 | $130,455 | $1,460 | 4.77% |
| ALTOONA, PA (FHA|USDA|VA) | 43 | $6,475,000 | $150,581 | $1,962 | 4.84% |
| LANCASTER, PA (FHA|USDA|VA) | 1 | $5,905,000 | $5,905,000 | $0 | 6.00% |
| Miami-Fort Lauderdale-Pompano Beach, FL (FHA|USDA|VA) | 2 | $4,940,000 | $2,470,000 | $16,352 | 4.38% |
| Philadelphia-Camden-Wilmington, PA-NJ-DE-MD (FHA|USDA|VA) | 2 | $3,230,000 | $1,615,000 | $0 | 4.82% |
| Outside of Metro Areas | 37 | $2,935,000 | $79,324 | $1,353 | 4.53% |
| Ashtabula, OH (FHA|USDA|VA) | 25 | $2,555,000 | $102,200 | $1,997 | 4.80% |
| JOHNSTOWN, PA (FHA|USDA|VA) | 35 | $2,445,000 | $69,857 | $970 | 4.81% |
| Jamestown-Dunkirk-Fredonia, NY (FHA|USDA|VA) | 12 | $2,320,000 | $193,333 | $1,436 | 4.55% |
| Indiana, PA (FHA|USDA|VA) | 16 | $1,590,000 | $99,375 | $1,630 | 4.76% |
| Marion, OH (FHA|USDA|VA) | 8 | $1,580,000 | $197,500 | $1,934 | 3.98% |
| Bucyrus-Galion, OH (FHA|USDA|VA) | 23 | $1,565,000 | $68,043 | $893 | 4.88% |
| Los Angeles-Long Beach-Anaheim, CA (FHA|USDA|VA) | 2 | $1,560,000 | $780,000 | $3,200 | 3.88% |
| SANTA MARIA-SANTA BARBARA, CA (FHA|USDA|VA) | 1 | $1,505,000 | $1,505,000 | $4,871 | 3.50% |
| Olean, NY (FHA|USDA|VA) | 9 | $1,015,000 | $112,778 | $955 | 4.58% |
| WILMINGTON, NC (FHA|USDA|VA) | 1 | $1,005,000 | $1,005,000 | $4,352 | 2.75% |
| Zanesville, OH (FHA|USDA|VA) | 2 | $850,000 | $425,000 | $7,096 | 3.82% |
| Key West, FL (FHA|USDA|VA) | 2 | $760,000 | $380,000 | $7,476 | 4.69% |
| CAPE CORAL-FORT MYERS, FL (FHA|USDA|VA) | 2 | $680,000 | $340,000 | $3,873 | 3.38% |
| PITTSBURGH, PA (FHA|USDA|VA) | 4 | $610,000 | $152,500 | $1,649 | 4.58% |
| NAPLES-MARCO ISLAND, FL (FHA|USDA|VA) | 2 | $580,000 | $290,000 | $3,960 | 4.50% |
| Mount Vernon, OH (FHA|USDA|VA) | 6 | $580,000 | $96,667 | $329 | 5.51% |
| MANSFIELD, OH (FHA|USDA|VA) | 7 | $525,000 | $75,000 | $328 | 4.71% |
| Greenwood, SC (FHA|USDA|VA) | 1 | $485,000 | $485,000 | $3,060 | 2.75% |
| JACKSONVILLE, NC (FHA|USDA|VA) | 2 | $410,000 | $205,000 | $2,496 | 4.53% |
| HARTFORD-EAST HARTFORD-MIDDLETOWN, CT (FHA|USDA|VA) | 1 | $355,000 | $355,000 | $3,718 | 3.13% |
| YOUNGSTOWN-WARREN-BOARDMAN, OH-PA (FHA|USDA|VA) | 4 | $350,000 | $87,500 | $2,362 | 4.84% |
| AKRON, OH (FHA|USDA|VA) | 2 | $340,000 | $170,000 | $2,733 | 5.13% |
| Washington-Arlington-Alexandria, DC-VA-MD-WV (FHA|USDA|VA) | 1 | $335,000 | $335,000 | $3,748 | 2.75% |
| TOLEDO, OH (FHA|USDA|VA) | 1 | $285,000 | $285,000 | $3,202 | 3.13% |
| Sandusky, OH (FHA|USDA|VA) | 1 | $255,000 | $255,000 | $0 | 5.00% |
| HILTON HEAD ISLAND-BLUFFTON, SC (FHA|USDA|VA) | 1 | $255,000 | $255,000 | $0 | 4.75% |
| Chillicothe, OH (FHA|USDA|VA) | 1 | $255,000 | $255,000 | $310 | 3.99% |
| ORLANDO-KISSIMMEE-SANFORD, FL (FHA|USDA|VA) | 1 | $235,000 | $235,000 | $2,868 | 4.38% |
| Huntingdon, PA (FHA|USDA|VA) | 3 | $205,000 | $68,333 | $315 | 5.22% |
| HARRISBURG-CARLISLE, PA (FHA|USDA|VA) | 1 | $205,000 | $205,000 | $4,188 | 3.63% |
| VIRGINIA BEACH-NORFOLK-NEWPORT NEWS, VA-NC (FHA|USDA|VA) | 1 | $205,000 | $205,000 | $2,500 | 4.63% |
| AUGUSTA-RICHMOND COUNTY, GA-SC (FHA|USDA|VA) | 1 | $195,000 | $195,000 | $2,886 | 3.50% |
| Lewistown, PA (FHA|USDA|VA) | 1 | $155,000 | $155,000 | $333 | 4.74% |
| ALLENTOWN-BETHLEHEM-EASTON, PA-NJ (FHA|USDA|VA) | 1 | $145,000 | $145,000 | $249 | 4.24% |
| Bellefontaine, OH (FHA|USDA|VA) | 1 | $135,000 | $135,000 | $302 | 3.49% |
| Somerset, PA (FHA|USDA|VA) | 1 | $105,000 | $105,000 | $0 | 4.25% |
| CINCINNATI, OH-KY-IN (FHA|USDA|VA) | 1 | $105,000 | $105,000 | $321 | 3.99% |
| GREENSBORO-HIGH POINT, NC (FHA|USDA|VA) | 1 | $95,000 | $95,000 | $2,279 | 3.75% |
| HOMOSASSA SPRINGS, FL (FHA|USDA|VA) | 1 | $95,000 | $95,000 | $0 | 5.66% |
| GOLDSBORO, NC (FHA|USDA|VA) | 1 | $85,000 | $85,000 | $0 | 5.40% |
| BLOOMSBURG-BERWICK, PA (FHA|USDA|VA) | 1 | $85,000 | $85,000 | $323 | 4.99% |
| READING, PA (FHA|USDA|VA) | 1 | $75,000 | $75,000 | $219 | 3.99% |
| Tiffin, OH (FHA|USDA|VA) | 1 | $65,000 | $65,000 | $266 | 4.99% |
| Oil City, PA (FHA|USDA|VA) | 2 | $60,000 | $30,000 | $765 | 4.88% |
| Norwalk, OH (FHA|USDA|VA) | 2 | $50,000 | $25,000 | $239 | 4.87% |
| Batavia, NY (FHA|USDA|VA) | 1 | $25,000 | $25,000 | $0 | 5.50% |
| PANAMA CITY, FL (FHA|USDA|VA) | 1 | $15,000 | $15,000 | $0 | 5.25% |
| SALISBURY, MD-DE (FHA|USDA|VA) | 1 | $15,000 | $15,000 | $0 | 5.00% |
Similar Lenders
We use machine learning to identify the top lenders compared against CNB Bank based on their rates and fees, along with other useful metrics. A lower similarity rank signals a stronger match.
Similarity Rank: 12
Similarity Rank: 33
Similarity Rank: 50
Similarity Rank: 50
Similarity Rank: 78
Similarity Rank: 90
Similarity Rank: 102
Similarity Rank: 105
Similarity Rank: 112
Similarity Rank: 121
Product Mix
| Loan Type | Originations | Total Value | Avg. Loan | Avg. Fees | Avg. Rate |
|---|---|---|---|---|---|
| Conventional | 1,561 | $309,325,000 | $198,158 | $1,584 | 4.67% |
| HELOC | 329 | $38,865,000 | $118,131 | n/a | 5.29% |
For 2019, Cnb Bank's most frequently originated type of loan was Conventional, with 1,561 originations. Their 2nd most popular type was HELOC, with 329 originations.
Loan Reason
For 2019, Cnb Bank's most frequently cited loan purpose was Home Purchase, with 688 originations. The 2nd most popular reason was Refi, with 602 originations.
Loan Duration/Length
For 2019, Cnb Bank's most frequently cited loan duration was 15 Year, with 804 originations. The 2nd most popular length was 30 Year, with 278 originations.
Origination Fees/Closing Costs
Cnb Bank's average total fees were $3,299, while their most frequently occuring range of origination fees (closing costs) were in the $<1k bucket, with 1,213 originations.
Interest Rates
During 2019, Cnb Bank's average interest rate for loans was 4.06%, while their most frequently originated rate bucket for loans was 4-5%, with 943 originations.
Loan Sizing
2019 saw Cnb Bank place emphasis on $100,000 or less loans with 1,074 originations, totaling $56,190,000 in origination value.
Applicant Income
Cnb Bank lent most frequently to those with incomes in the $50k-75k range, with 382 originations. The second most popular income band? $100k-150k, with 324 originations.
Applicant Debt to Income Ratio
Cnb Bank lent most frequently to those with DTI ratios of 20-30%, with 481 originations. The next most common DTI ratio? 30-36%, with 320 originations.
Ethnicity Mix
Approval Rates
Total approvals of all applications86.06%
Cnb Bank has an average approval rate.
Pick Rate
Approvals leading to origination88.99%
Cnb Bank has an average pick rate.
Points and Fees
| Points | Originations | Total Value | Average Loan |
|---|---|---|---|
| 0.0 | 2 | $30,000 | $15,000 |
| 100.0 | 12 | $530,000 | $44,167 |
| NA | 1,876 | $347,630,000 | $185,304 |
Occupancy Type Mix
LTV Distribution
Bank Details
Branches
| Bank Name | Branch | Branch Type | Deposits (000's) |
|---|---|---|---|
| CNB Bank | 1001 East Main Street Bradford, PA 16701 | Full Service B&M | $16,307 |
| CNB Bank | 101 Industrial Park Road Clearfield, PA 16830 | Full Service B&M | $23,403 |
| CNB Bank | 101 West 10th Street Erie, PA 16501 | Full Service B&M | $98,130 |
| CNB Bank | 103 E. Main St Cardington, OH 43315 | Full Service B&M | $41,110 |
| CNB Bank | 105 Washington Square Bucyrus, OH 44820 | Full Service B&M | $126,308 |
| CNB Bank | 107 Lamppost Lane Duncansville, PA 16635 | Full Service B&M | $16,404 |
| CNB Bank | 1104 Million Dollar Highway Kersey, PA 15846 | Full Service B&M | $43,522 |
| CNB Bank | 111 Rolling Stone Road, Mountain View Shopping Center Kylertown, PA 16847 | Full Service B&M | $18,481 |
| CNB Bank | 117 East Presqueisle Street Philipsburg, PA 16866 | Full Service B&M | $75,769 |
| CNB Bank | 12 Chambers Street Bradford, PA 16701 | Full Service B&M | $53,600 |
| CNB Bank | 1231 Old Town Rd Clearfield, PA 16830 | Full Service B&M | $37,608 |
| CNB Bank | 133 Washington Street St. Marys, PA 15857 | Full Service B&M | $61,225 |
| CNB Bank | 1574 Beeline Highway Du Bois, PA 15801 | Full Service B&M | $48,749 |
| CNB Bank | 16039 Conneaut Lake Road, Suite 108 Meadville, PA 16335 | Full Service B&M | $10,724 |
| CNB Bank | 1808 Bigler Avenue Northern Cambria, PA 15714 | Full Service B&M | $51,200 |
| CNB Bank | 1921 B Free Rd Shiloh, OH 44878 | Full Service B&M | $21,202 |
| CNB Bank | 2035 Edinboro Road Erie, PA 16509 | Full Service B&M | $230,777 |
| CNB Bank | 2302 West 12th Street Erie, PA 16505 | Full Service B&M | $36,741 |
| CNB Bank | 240 West Sandusky Street Fredericktown, OH 43019 | Full Service B&M | $33,822 |
| CNB Bank | 25 Irwin Drive Philipsburg, PA 16866 | Full Service B&M | $38,136 |
| CNB Bank | 2615 Asbury Road Erie, PA 16506 | Full Service B&M | $91,474 |
| CNB Bank | 2821 Fishinger Rd Upper Arlington, OH 43221 | Full Service B&M | $35,515 |
| CNB Bank | 301 Main Street Ridgway, PA 15853 | Full Service B&M | $63,530 |
| CNB Bank | 301 Pennsylvania Avenue, Suite 101 Warren, PA 16365 | Full Service B&M | $60,438 |
| CNB Bank | 3049 Orchard Park Road Orchard Park, NY 14127 | Full Service B&M | $140,684 |
| CNB Bank | 3602 Main Street Karthaus, PA 16845 | Full Service B&M | $12,249 |
| CNB Bank | 3606 State Road Ashtabula, OH 44004 | Full Service B&M | $31,175 |
| CNB Bank | 4545 W. Dublin Granville Road Dublin, OH 43017 | Full Service B&M | $6,947 |
| CNB Bank | 485 Spring Street Houtzdale, PA 16651 | Full Service B&M | $47,335 |
| CNB Bank | 5190 Sheridan Drive Williamsville, NY 14221 | Full Service B&M | $159,597 |
| CNB Bank | 535 Washington Street, Suite 101 Buffalo, NY 14203 | Full Service B&M | $80,213 |
| CNB Bank | 559 West Mahoning Street Punxsutawney, PA 15767 | Full Service B&M | $51,046 |
| CNB Bank | 5723 Buffalo Road Harborcreek, PA 16421 | Full Service B&M | $38,485 |
| CNB Bank | 611 Lingle Street Osceola Mills, PA 16666 | Full Service B&M | $25,913 |
| CNB Bank | 6600 North High Street Worthington, OH 43085 | Full Service B&M | $86,228 |
| CNB Bank | 665 Philadelphia Street Indiana, PA 15701 | Full Service B&M | $23,258 |
| CNB Bank | 6947 Williams Road Niagara Falls, NY 14304 | Full Service B&M | $53,154 |
| CNB Bank | 7322 Mentor Ave Mentor, OH 44060 | Full Service B&M | $16,426 |
| CNB Bank | 7402 Center Street Mentor, OH 44060 | Full Service B&M | $119,221 |
| CNB Bank | 87 Fraley Street Kane, PA 16735 | Full Service B&M | $27,746 |
| CNB Bank | 885 Park Avenue Meadville, PA 16335 | Full Service B&M | $180,812 |
| CNB Bank | One South Second Street Clearfield, PA 16830 | Full Service B&M | $303,505 |
For 2019, Cnb Bank had 42 branches.
Yearly Performance Overview
Bank Income
| Item | Value (in 000's) |
|---|---|
| Total interest income | $151,781 |
| Net interest income | $115,947 |
| Total noninterest income | $22,588 |
| Gross Fiduciary activities income | $4,328 |
| Service charges on deposit accounts | $6,402 |
| Trading account gains and fees | $507 |
| Additional Noninterest Income | $11,351 |
| Pre-tax net operating income | $49,170 |
| Securities gains (or losses, -) | $148 |
| Income before extraordinary items | $40,276 |
| Discontinued Operations (Extraordinary gains, net) | $0 |
| Net income of bank and minority interests | $40,276 |
| Minority interest net income | $0 |
| Net income | $40,276 |
| Sale, conversion, retirement of capital stock, net | $0 |
| Net operating income | $40,154 |
Cnb Bank's gross interest income from loans was $151,781,000.
Cnb Bank's net interest income from loans was $115,947,000.
Cnb Bank's fee based income from loans was $6,402,000.
Cnb Bank's net income from loans was $40,276,000.
Bank Expenses
| Item | Value (in 000's) |
|---|---|
| Total interest expense | $35,834 |
| Provision for credit losses | $4,005 |
| Total noninterest expense | $85,360 |
| Salaries and employee benefits | $44,596 |
| Premises and equipment expense | $11,861 |
| Additional noninterest expense | $28,903 |
| Applicable income taxes | $9,042 |
| Net charge-offs | $4,384 |
| Cash dividends | $12,696 |
Cnb Bank's interest expense for loans was $35,834,000.
Cnb Bank's payroll and benefits expense were $44,596,000.
Cnb Bank's property, plant and equipment expenses $11,861,000.
Loan Performance
| Type of Loan | % of Loans Noncurrent (30+ days, end of period snapshot) |
|---|---|
| All loans | 0.0% |
| Real Estate loans | 0.0% |
| Construction & Land Development loans | 0.0% |
| Nonfarm, nonresidential loans | 0.0% |
| Multifamily residential loans | 0.0% |
| 1-4 family residential loans | 0.0% |
| HELOC loans | 0.0% |
| All other family | 0.0% |
| Commercial & industrial loans | 0.0% |
| Personal loans | 0.0% |
| Credit card loans | 0.0% |
| Other individual loans | 0.0% |
| Auto loans | 0.0% |
| Other consumer loans | 0.0% |
| Unsecured commercial real estate loans | 0.0% |
Deposits
| Type | Value (in 000's) |
|---|---|
| Total deposits | $3,102,630 |
| Deposits held in domestic offices | $3,102,630 |
| Deposits by Individuals, partnerships, and corporations | $2,868,598 |
| Deposits by U.S. Government | $0 |
| Deposits by States and political subdivisions in the U.S. | $234,032 |
| Deposits by Commercial banks and other depository institutions in U.S. | $0 |
| Deposits by Banks in foreign countries | $0 |
| Deposits by Foreign governments and official institutions | $0 |
| Transaction accounts | $198,001 |
| Demand deposits | $133,747 |
| Nontransaction accounts | $2,904,629 |
| Money market deposit accounts (MMDAs) | $9,787 |
| Other savings deposits (excluding MMDAs) | $2,467,045 |
| Total time deposits | $427,796 |
| Total time and savings deposits | $2,968,883 |
| Noninterest-bearing deposits | $382,562 |
| Interest-bearing deposits | $2,720,068 |
| Retail deposits | $3,000,563 |
| IRAs and Keogh plan accounts | $74,908 |
| Brokered deposits | $0 |
| Deposits held in foreign offices | $0 |
Assets
| Asset | Value (in 000's) |
|---|---|
| Total Assets | $3,740,508 |
| Cash & Balances due from depository institutions | $187,202 |
| Interest-bearing balances | $145,627 |
| Total securities | $541,959 |
| Federal funds sold & reverse repurchase | $0 |
| Net loans and leases | $2,779,667 |
| Loan and leases loss allowance | $17,526 |
| Trading account assets | $3,170 |
| Bank premises and fixed assets | $71,882 |
| Other real estate owned | $1,633 |
| Goodwill and other intangibles | $40,338 |
| All other assets | $114,657 |
Liabilities
| Liabilities | Value (in 000's) |
|---|---|
| Total liabilities and capital | $3,740,508 |
| Total Liabilities | $3,383,822 |
| Total deposits | $3,102,630 |
| Interest-bearing deposits | $2,720,068 |
| Deposits held in domestic offices | $3,102,630 |
| % insured (estimated) | $67 |
| Federal funds purchased and repurchase agreements | $0 |
| Trading liabilities | $0 |
| Other borrowed funds | $246,592 |
| Subordinated debt | $0 |
| All other liabilities | $34,600 |
Issued Loan Types
| Type | Value (in 000's) |
|---|---|
| Net loans and leases | $2,779,667 |
| Loan and leases loss allowance | $17,526 |
| Total loans and leases (domestic) | $2,797,193 |
| All real estate loans | $2,052,558 |
| Real estate loans in domestic offices | $2,052,558 |
| Construction and development loans | $299,739 |
| Residential 1-4 family construction | $22,426 |
| Other construction, all land development and other land | $277,313 |
| Loans secured by nonfarm nonresidential properties | $801,049 |
| Nonfarm nonresidential secured by owner-occupied properties | $333,096 |
| Commercial real estate & other non-farm, non-residential | $467,953 |
| Multifamily residential real estate | $124,387 |
| 1-4 family residential loans | $800,184 |
| Farmland loans | $27,199 |
| Loans held in foreign offices | $0 |
| Farm loans | $3,407 |
| Commercial and industrial loans | $474,714 |
| To non-U.S. addressees | $0 |
| Loans to individuals | $106,534 |
| Credit card loans | $7,569 |
| Related Plans | $52,353 |
| Consumer Auto Loans | $27,733 |
| Other loans to individuals | $18,879 |
| All other loans & leases | $159,980 |
| Loans to foreign governments and official institutions | $0 |
| Other loans | $20,928 |
| Loans to depository institutions and acceptances of other banks | $0 |
| Loans not secured by real estate | $0 |
| Loans secured by real estate to non-U.S. addressees | $0 |
| Restructured Loans & leases | $6,766 |
| Non 1-4 family restructured loans & leases | $6,766 |
| Total loans and leases (foreign) | $0 |
CNB Bank had $2,779,667,000 of loans outstanding in 2019. $2,052,558,000 of loans were in real estate loans. $299,739,000 of loans were in development loans. $124,387,000 of loans were in multifamily mortgage loans. $800,184,000 of loans were in 1-4 family mortgage loans. $3,407,000 of loans were in farm loans. $7,569,000 of loans were in credit card loans. $27,733,000 of loans were in the auto loan category.
Small Business Loans
| Categorization | # of Loans in Category | $ amount of loans (in 000's) | Average $/loan |
|---|---|---|---|
| Nonfarm, nonresidential loans - <$1MM | 1,425 | $261,507 | $183,514 |
| Nonfarm, nonresidential loans - <$100k | 454 | $17,241 | $37,976 |
| Nonfarm, nonresidential loans - $100-250k | 517 | $64,060 | $123,907 |
| Nonfarm, nonresidential loans - $250k-1MM | 454 | $180,206 | $396,930 |
| Commercial & Industrial, US addressed loans - <$1MM | 3,357 | $207,107 | $61,694 |
| Commercial & Industrial, US addressed loans - <$100k | 2,535 | $58,175 | $22,949 |
| Commercial & Industrial, US addressed loans - $100-250k | 447 | $43,356 | $96,993 |
| Commercial & Industrial, US addressed loans - $250k-1MM | 375 | $105,576 | $281,536 |
| Farmland loans - <$1MM | 70 | $9,149 | $130,700 |
| Farmland loans - <$100k | 20 | $1,071 | $53,550 |
| Farmland loans - $100-250k | 32 | $4,074 | $127,313 |
| Farmland loans - $250k-1MM | 18 | $4,004 | $222,444 |
| Agriculture operations loans - <$1MM | 76 | $2,857 | $37,592 |
| Agriculture operations loans - <$100k | 63 | $1,302 | $20,667 |
| Agriculture operations loans - $100-250k | 11 | $1,102 | $100,182 |
| Agriculture operations loans - $250k-1MM | 2 | $453 | $226,500 |