Old Second National Bank Mortgage Rates, Fees & Info
Aurora, ILLEI: B94HV8SXGDD3J5XESU08
Tax ID: 36-1577458
Latest/2024 | 2023 Data | 2022 Data | 2021 Data | 2020 Data | 2019 Data | 2018 Data
Jump to:
Mortgage Data
Bank Data
Review & Overview
Old Second National Bank is a smaller bank specializing in Refi and Home Purchase loans. Old Second National Bank has a high proportion of conventional loans. They have a a low proportion of FHA loans. (This may mean they shy away from first time homebuyers.) Their top markets by origination volume include: Chicago, Ottawa, Phoenix, Naples, and Charlotte among others. We have data for 67 markets. (Some data included below & more in-depth data is available with an active subscription.)Old Second National Bank has an above average approval rate when compared to the average across all lenders. They have a below average pick rate when compared to similar lenders. Old Second National Bank is typically a low fee lender. (We use the term "fees" to include things like closing costs and other costs incurred by borrowers-- whether they are paid out of pocket or rolled into the loan.) They typically have about average rates.
We show data for every lender and do not change our ratings-- even if an organization is a paid advertiser. Our consensus data does have lag, but it is highly correlated to a lender's rates & fees relative to their markets. This means that if a bank is a low fee/rate lender the past-- chances are they are still one today. Our SimulatedRates™ use advanced statistical techniques to forecast different rates based on a lender's historical data.
Mortgage seekers: Choose your metro area here to explore the lowest fee & rate lenders.
Mortgage professionals: We have various tools to make your lives easier. Contact us to see how we can help with your market research, analytics or advertising needs.
SimulatedRates™Mortgage Type |
Simulated Rate | Simulation Date |
|---|---|---|
| Home Equity Line of Credit (HELOC) | 6.76% | 7/10/26 |
| 30 Year Conventional Purchase | 7.29% | 7/10/26 |
| 30 Year Conventional Refi | 6.98% | 7/10/26 |
| 30 Year Cash-out Refi | 7.36% | 7/10/26 |
| 30 Year FHA Purchase | 7.20% | 7/10/26 |
| 30 Year FHA Refi | 6.72% | 7/10/26 |
| 30 Year VA Purchase | 7.04% | 7/10/26 |
| 15 Year Conventional Purchase | 6.94% | 7/10/26 |
| 15 Year Conventional Refi | 6.74% | 7/10/26 |
| 15 Year Cash-out Refi | 6.74% | 7/10/26 |
| These are simulated rates generated by our proprietary machine learning models. These are not guaranteed by the bank. They are our estimates based on a lender's past behaviors combined with current market conditions. Contact an individual lender for their actual rates. Our models use fixed rate terms for conforming loans, 700+ FICO, 10% down for FHA and 20% for conventional. These are based on consensus, historical data-- not advertised promotional rates. | ||
Old Second National Bank Mortgage Calculator
Your Estimates
Estimated Loan Payment: Update the calculator values and click calculate payment!
This is not an official calculator from Old Second National Bank. It uses our SimulatedRate™
technology, basic math and reasonable assumptions to calculate mortgage payments derived from our simulations and your inputs.
The default purchase price is the median sales price across the US for 2022Q4, per FRED.
Originations
1,773Origination Dollar Volume (All Markets)
$418,015,000Employee count
533Awards
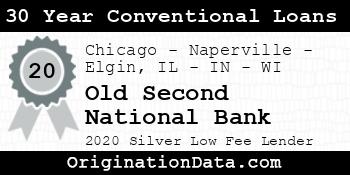
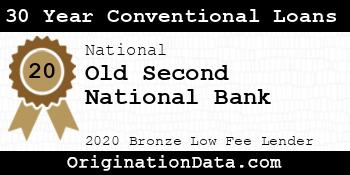
Old Second National Bank - 2020
Old Second National Bank is a 2020 , due to their low .
For 2020, less than of lenders were eligible for this award.
Work for Old Second National Bank?
Use this award on your own site. Either save and use the images below, or pass the provided image embed code to your development team.
Top Markets
Zoom/scroll map to see bank's per metro statistics. Subscribers can configure state/metro/county granularity, assorted fields and quantity of results. This map shows top 10 markets in the map viewport, as defined by descending origination volume.
| Market | Originations | Total Value | Average Loan | Average Fees | Average Rate |
|---|---|---|---|---|---|
| Chicago-Naperville-Elgin, IL-IN-WI (FHA|USDA|VA) | 1,561 | $366,635,000 | $234,872 | $2,564 | 3.23% |
| Ottawa, IL (FHA|USDA|VA) | 55 | $9,665,000 | $175,727 | $2,872 | 3.25% |
| PHOENIX-MESA-CHANDLER, AZ (FHA|USDA|VA) | 17 | $5,675,000 | $333,824 | $3,237 | 3.18% |
| Outside of Metro Areas | 16 | $4,370,000 | $273,125 | $2,426 | 3.17% |
| NAPLES-MARCO ISLAND, FL (FHA|USDA|VA) | 7 | $2,445,000 | $349,286 | $3,696 | 3.00% |
| CHARLOTTE-CONCORD-GASTONIA, NC-SC (FHA|USDA|VA) | 7 | $1,935,000 | $276,429 | $4,989 | 3.11% |
| NILES, MI (FHA|USDA|VA) | 4 | $1,500,000 | $375,000 | $2,325 | 3.19% |
| ROCKFORD, IL (FHA|USDA|VA) | 8 | $1,460,000 | $182,500 | $2,386 | 3.02% |
| North Port-Sarasota-Bradenton, FL (FHA|USDA|VA) | 4 | $1,450,000 | $362,500 | $3,974 | 3.19% |
| CAPE CORAL-FORT MYERS, FL (FHA|USDA|VA) | 4 | $1,390,000 | $347,500 | $4,454 | 3.41% |
| ST. LOUIS, MO-IL (FHA|USDA|VA) | 5 | $1,275,000 | $255,000 | $2,094 | 3.60% |
| CHARLESTON-NORTH CHARLESTON, SC (FHA|USDA|VA) | 3 | $1,155,000 | $385,000 | $3,232 | 3.21% |
| TAMPA-ST. PETERSBURG-CLEARWATER, FL (FHA|USDA|VA) | 4 | $1,130,000 | $282,500 | $4,215 | 3.09% |
| Rochelle, IL (FHA|USDA|VA) | 7 | $1,015,000 | $145,000 | $1,967 | 3.38% |
| NASHVILLE-DAVIDSON-MURFREESBORO-FRANKLIN, TN (FHA|USDA|VA) | 3 | $1,005,000 | $335,000 | $2,580 | 3.00% |
| MYRTLE BEACH-CONWAY-NORTH MYRTLE BEACH, SC-NC (FHA|USDA|VA) | 3 | $855,000 | $285,000 | $3,323 | 3.92% |
| Washington-Arlington-Alexandria, DC-VA-MD-WV (FHA|USDA|VA) | 2 | $660,000 | $330,000 | $2,900 | 2.69% |
| Whitewater, WI (FHA|USDA|VA) | 2 | $630,000 | $315,000 | $1,836 | 3.06% |
| AUSTIN-ROUND ROCK-GEORGETOWN, TX (FHA|USDA|VA) | 2 | $580,000 | $290,000 | $4,936 | 2.50% |
| LAS VEGAS-HENDERSON-PARADISE, NV (FHA|USDA|VA) | 2 | $520,000 | $260,000 | $2,516 | 3.00% |
| Steamboat Springs, CO (FHA|USDA|VA) | 1 | $515,000 | $515,000 | $2,885 | 2.88% |
| SAN DIEGO-CHULA VISTA-CARLSBAD, CA (FHA|USDA|VA) | 1 | $515,000 | $515,000 | $4,355 | 3.50% |
| BRIDGEPORT-STAMFORD-NORWALK, CT (FHA|USDA|VA) | 1 | $505,000 | $505,000 | $4,071 | 2.88% |
| MICHIGAN CITY-LA PORTE, IN (FHA|USDA|VA) | 2 | $500,000 | $250,000 | $2,349 | 3.00% |
| Dixon, IL (FHA|USDA|VA) | 3 | $465,000 | $155,000 | $2,401 | 3.92% |
| FRESNO, CA (FHA|USDA|VA) | 2 | $460,000 | $230,000 | $2,431 | 3.06% |
| DENVER-AURORA-LAKEWOOD, CO (FHA|USDA|VA) | 1 | $455,000 | $455,000 | $2,955 | 4.00% |
| GREENVILLE-ANDERSON, SC (FHA|USDA|VA) | 1 | $445,000 | $445,000 | $2,974 | 3.00% |
| KNOXVILLE, TN (FHA|USDA|VA) | 2 | $400,000 | $200,000 | $2,900 | 2.56% |
| Dallas-Fort Worth-Arlington, TX (FHA|USDA|VA) | 2 | $390,000 | $195,000 | $3,981 | 3.06% |
| Union City, TN (FHA|USDA|VA) | 2 | $390,000 | $195,000 | $2,946 | 2.81% |
| KANSAS CITY, MO-KS (FHA|USDA|VA) | 1 | $375,000 | $375,000 | $2,512 | 3.13% |
| Red Wing, MN (FHA|USDA|VA) | 1 | $365,000 | $365,000 | $2,502 | 3.38% |
| INDIANAPOLIS-CARMEL-ANDERSON, IN (FHA|USDA|VA) | 2 | $360,000 | $180,000 | $2,463 | 3.38% |
| ORLANDO-KISSIMMEE-SANFORD, FL (FHA|USDA|VA) | 2 | $330,000 | $165,000 | $2,450 | 3.88% |
| MILWAUKEE-WAUKESHA, WI (FHA|USDA|VA) | 1 | $315,000 | $315,000 | $2,343 | 3.00% |
| Jacksonville, TX (FHA|USDA|VA) | 1 | $315,000 | $315,000 | $3,510 | 3.13% |
| MORRISTOWN, TN (FHA|USDA|VA) | 1 | $265,000 | $265,000 | $2,340 | 2.63% |
| Wisconsin Rapids-Marshfield, WI (FHA|USDA|VA) | 1 | $265,000 | $265,000 | $1,973 | 3.13% |
| SALT LAKE CITY, UT (FHA|USDA|VA) | 1 | $265,000 | $265,000 | $1,963 | 2.50% |
| KANKAKEE, IL (FHA|USDA|VA) | 1 | $255,000 | $255,000 | $7,146 | 2.88% |
| APPLETON, WI (FHA|USDA|VA) | 1 | $245,000 | $245,000 | $2,216 | 3.50% |
| Los Angeles-Long Beach-Anaheim, CA (FHA|USDA|VA) | 1 | $235,000 | $235,000 | $2,813 | 3.13% |
| Durango, CO (FHA|USDA|VA) | 1 | $235,000 | $235,000 | $7,588 | 4.13% |
| MADISON, WI (FHA|USDA|VA) | 1 | $225,000 | $225,000 | $2,341 | 3.88% |
| Milledgeville, GA (FHA|USDA|VA) | 1 | $215,000 | $215,000 | $3,083 | 3.38% |
| Watertown-Fort Atkinson, WI (FHA|USDA|VA) | 1 | $215,000 | $215,000 | $2,345 | 3.50% |
| FORT COLLINS, CO (FHA|USDA|VA) | 1 | $205,000 | $205,000 | $2,808 | 2.50% |
| CINCINNATI, OH-KY-IN (FHA|USDA|VA) | 1 | $205,000 | $205,000 | $2,961 | 3.00% |
| Detroit-Warren-Dearborn, MI (FHA|USDA|VA) | 2 | $200,000 | $100,000 | $2,779 | 3.06% |
| Sault Ste. Marie, MI (FHA|USDA|VA) | 1 | $195,000 | $195,000 | $2,244 | 2.88% |
| JANESVILLE-BELOIT, WI (FHA|USDA|VA) | 1 | $195,000 | $195,000 | $3,005 | 2.88% |
| JACKSON, TN (FHA|USDA|VA) | 1 | $195,000 | $195,000 | $8,897 | 3.75% |
| DAVENPORT-MOLINE-ROCK ISLAND, IA-IL (FHA|USDA|VA) | 1 | $195,000 | $195,000 | $1,963 | 2.50% |
| DECATUR, AL (FHA|USDA|VA) | 1 | $195,000 | $195,000 | $2,538 | 3.00% |
| RALEIGH-CARY, NC (FHA|USDA|VA) | 1 | $185,000 | $185,000 | $2,983 | 3.13% |
| PANAMA CITY, FL (FHA|USDA|VA) | 1 | $155,000 | $155,000 | $0 | 3.63% |
| CEDAR RAPIDS, IA (FHA|USDA|VA) | 1 | $155,000 | $155,000 | $2,489 | 3.50% |
| Mountain Home, AR (FHA|USDA|VA) | 1 | $135,000 | $135,000 | $2,626 | 3.38% |
| Freeport, IL (FHA|USDA|VA) | 1 | $135,000 | $135,000 | $2,048 | 2.75% |
| Crossville, TN (FHA|USDA|VA) | 1 | $135,000 | $135,000 | $2,245 | 3.13% |
| LAFAYETTE-WEST LAFAYETTE, IN (FHA|USDA|VA) | 1 | $125,000 | $125,000 | $2,479 | 3.13% |
| YOUNGSTOWN-WARREN-BOARDMAN, OH-PA (FHA|USDA|VA) | 1 | $115,000 | $115,000 | $2,737 | 3.75% |
| BAY CITY, MI (FHA|USDA|VA) | 1 | $115,000 | $115,000 | $2,079 | 2.63% |
| LAKE HAVASU CITY-KINGMAN, AZ (FHA|USDA|VA) | 1 | $105,000 | $105,000 | $1,675 | 3.00% |
| Stevens Point, WI (FHA|USDA|VA) | 1 | $105,000 | $105,000 | $2,423 | 4.25% |
| DUBUQUE, IA (FHA|USDA|VA) | 1 | $95,000 | $95,000 | $0 | 4.13% |
Similar Lenders
We use machine learning to identify the top lenders compared against Old Second National Bank based on their rates and fees, along with other useful metrics. A lower similarity rank signals a stronger match.
Similarity Rank: 110
Similarity Rank: 135
Similarity Rank: 312
Similarity Rank: 312
Similarity Rank: 627
Similarity Rank: 648
Similarity Rank: 820
Similarity Rank: 988
Similarity Rank: 1360
Similarity Rank: 1610
Product Mix
| Loan Type | Originations | Total Value | Avg. Loan | Avg. Fees | Avg. Rate |
|---|---|---|---|---|---|
| Conventional | 1,694 | $401,030,000 | $236,736 | $2,391 | 3.23% |
| FHA | 64 | $12,160,000 | $190,000 | $7,647 | 3.29% |
| VA | 15 | $4,825,000 | $321,667 | $5,402 | 2.78% |
For 2020, Old Second National Bank's most frequently originated type of loan was Conventional, with 1,694 originations. Their 2nd most popular type was FHA, with 64 originations.
Loan Reason
For 2020, Old Second National Bank's most frequently cited loan purpose was Refi, with 1,020 originations. The 2nd most popular reason was Home Purchase, with 404 originations.
Loan Duration/Length
For 2020, Old Second National Bank's most frequently cited loan duration was 30 Year, with 1,109 originations. The 2nd most popular length was 15 Year, with 370 originations.
Origination Fees/Closing Costs
Old Second National Bank's average total fees were $3,024, while their most frequently occuring range of origination fees (closing costs) were in the $<1k bucket, with 1,570 originations.
Interest Rates
During 2020, Old Second National Bank's average interest rate for loans was 3.32%, while their most frequently originated rate bucket for loans was 3-4%, with 848 originations.
Loan Sizing
2020 saw Old Second National Bank place emphasis on $200k-400k loans with 773 originations, totaling $209,965,000 in origination value.
Applicant Income
Old Second National Bank lent most frequently to those with incomes in the $100k-150k range, with 439 originations. The second most popular income band? $75k-100k, with 341 originations.
Applicant Debt to Income Ratio
Old Second National Bank lent most frequently to those with DTI ratios of 20-30%, with 456 originations. The next most common DTI ratio? 30-36%, with 320 originations.
Ethnicity Mix
Approval Rates
Total approvals of all applications93.67%
Old Second National Bank has an average approval rate.
Pick Rate
Approvals leading to origination83.98%
Old Second National Bank has a below average pick rate.
Points and Fees
| Points | Originations | Total Value | Average Loan |
|---|---|---|---|
| NA | 1,773 | $418,015,000 | $235,767 |
Occupancy Type Mix
LTV Distribution
Bank Details
Branches
| Bank Name | Branch | Branch Type | Deposits (000's) |
|---|---|---|---|
| Old Second National Bank | 1200 Douglas Road Oswego, IL 60543 | Full Service B&M | $129,961 |
| Old Second National Bank | 1230 N. Orchard Road Aurora, IL 60506 | Full Service B&M | $70,246 |
| Old Second National Bank | 1301-1305 West Taylor Street Chicago, IL 60607 | Full Service B&M | $10,089 |
| Old Second National Bank | 1350 North Farnsworth Avenue Aurora, IL 60505 | Full Service B&M | $83,049 |
| Old Second National Bank | 1810 Dekalb Avenue Sycamore, IL 60178 | Full Service B&M | $35,339 |
| Old Second National Bank | 194 South Main Street Burlington, IL 60109 | Full Service B&M | $92,842 |
| Old Second National Bank | 195 West Joe Orr Road Chicago Heights, IL 60411 | Full Service B&M | $105,045 |
| Old Second National Bank | 1991 West Wilson Street Batavia, IL 60510 | Full Service B&M | $89,365 |
| Old Second National Bank | 200 West John Street North Aurora, IL 60542 | Full Service B&M | $90,906 |
| Old Second National Bank | 20201 South La Grange Road Frankfort, IL 60423 | Full Service B&M | $101,032 |
| Old Second National Bank | 26 West Countryside Parkway Yorkville, IL 60560 | Full Service B&M | $148,617 |
| Old Second National Bank | 2s101 Harter Road Kaneville, IL 60144 | Full Service B&M | $23,860 |
| Old Second National Bank | 3101 Ogden Road Lisle, IL 60532 | Full Service B&M | $21,506 |
| Old Second National Bank | 323 East Norris Drive Ottawa, IL 61350 | Full Service B&M | $57,179 |
| Old Second National Bank | 3290 Us Highway 20 And Nesler Road Elgin, IL 60123 | Full Service B&M | $26,817 |
| Old Second National Bank | 333 West Wacker Drive, Suite 710 Chicago, IL 60606 | Full Service Retail | $160,901 |
| Old Second National Bank | 37-39 South River Street Aurora, IL 60506 | Full Service B&M | $609,752 |
| Old Second National Bank | 4080 Fox Valley Center Drive Aurora, IL 60504 | Full Service B&M | $44,631 |
| Old Second National Bank | 40w 422 Il-64 Wasco, IL 60183 | Full Service B&M | $54,506 |
| Old Second National Bank | 555 Redwood Drive Aurora, IL 60506 | Full Service B&M | $82,687 |
| Old Second National Bank | 6400 W. North Avenue Chicago, IL 60707 | Full Service B&M | $61,286 |
| Old Second National Bank | 7050 Burroughs Avenue Plano, IL 60545 | Full Service B&M | $38,600 |
| Old Second National Bank | 749 North Main Street Elburn, IL 60119 | Full Service B&M | $126,189 |
| Old Second National Bank | 801 S. Kirk Road Saint Charles, IL 60174 | Full Service B&M | $35,157 |
| Old Second National Bank | 850 Essington Joliet, IL 60435 | Full Service B&M | $27,449 |
| Old Second National Bank | 901 Essington Road Joliet, IL 60435 | Full Service B&M | $0 |
| Old Second National Bank | 9443 South Ashland Avenue Chicago, IL 60620 | Full Service B&M | $24,986 |
| Old Second National Bank | Cross Street At Illinois Route 47 Sugar Grove, IL 60554 | Full Service B&M | $73,877 |
| Old Second National Bank | Two South York Road Bensenville, IL 60106 | Full Service B&M | $62,741 |
For 2020, Old Second National Bank had 29 branches.
Yearly Performance Overview
Bank Income
| Item | Value (in 000's) |
|---|---|
| Total interest income | $104,184 |
| Net interest income | $96,990 |
| Total noninterest income | $37,311 |
| Gross Fiduciary activities income | $6,410 |
| Service charges on deposit accounts | $5,512 |
| Trading account gains and fees | $0 |
| Additional Noninterest Income | $25,389 |
| Pre-tax net operating income | $46,341 |
| Securities gains (or losses, -) | $-25 |
| Income before extraordinary items | $34,518 |
| Discontinued Operations (Extraordinary gains, net) | $0 |
| Net income of bank and minority interests | $34,518 |
| Minority interest net income | $0 |
| Net income | $34,518 |
| Sale, conversion, retirement of capital stock, net | $0 |
| Net operating income | $34,537 |
Old Second National Bank's gross interest income from loans was $104,184,000.
Old Second National Bank's net interest income from loans was $96,990,000.
Old Second National Bank's fee based income from loans was $5,512,000.
Old Second National Bank's net income from loans was $34,518,000.
Bank Expenses
| Item | Value (in 000's) |
|---|---|
| Total interest expense | $7,194 |
| Provision for credit losses | $10,413 |
| Total noninterest expense | $77,547 |
| Salaries and employee benefits | $46,814 |
| Premises and equipment expense | $8,456 |
| Additional noninterest expense | $22,277 |
| Applicable income taxes | $11,798 |
| Net charge-offs | $979 |
| Cash dividends | $41,300 |
Old Second National Bank's interest expense for loans was $7,194,000.
Old Second National Bank's payroll and benefits expense were $46,814,000.
Old Second National Bank's property, plant and equipment expenses $8,456,000.
Loan Performance
| Type of Loan | % of Loans Noncurrent (30+ days, end of period snapshot) |
|---|---|
| All loans | 1.0% |
| Real Estate loans | 1.0% |
| Construction & Land Development loans | 0.0% |
| Nonfarm, nonresidential loans | 1.0% |
| Multifamily residential loans | 1.0% |
| 1-4 family residential loans | 1.0% |
| HELOC loans | 0.0% |
| All other family | 2.0% |
| Commercial & industrial loans | 0.0% |
| Personal loans | 0.0% |
| Credit card loans | 0.0% |
| Other individual loans | 0.0% |
| Auto loans | 0.0% |
| Other consumer loans | 0.0% |
| Unsecured commercial real estate loans | 0.0% |
Deposits
| Type | Value (in 000's) |
|---|---|
| Total deposits | $2,584,674 |
| Deposits held in domestic offices | $2,584,674 |
| Deposits by Individuals, partnerships, and corporations | $2,379,230 |
| Deposits by U.S. Government | $0 |
| Deposits by States and political subdivisions in the U.S. | $201,814 |
| Deposits by Commercial banks and other depository institutions in U.S. | $3,630 |
| Deposits by Banks in foreign countries | $0 |
| Deposits by Foreign governments and official institutions | $0 |
| Transaction accounts | $346,321 |
| Demand deposits | $259,611 |
| Nontransaction accounts | $2,238,353 |
| Money market deposit accounts (MMDAs) | $1,401,837 |
| Other savings deposits (excluding MMDAs) | $411,082 |
| Total time deposits | $425,434 |
| Total time and savings deposits | $2,325,063 |
| Noninterest-bearing deposits | $346,321 |
| Interest-bearing deposits | $2,238,353 |
| Retail deposits | $2,524,329 |
| IRAs and Keogh plan accounts | $57,758 |
| Brokered deposits | $0 |
| Deposits held in foreign offices | $0 |
Assets
| Asset | Value (in 000's) |
|---|---|
| Total Assets | $3,046,940 |
| Cash & Balances due from depository institutions | $329,903 |
| Interest-bearing balances | $305,597 |
| Total securities | $496,178 |
| Federal funds sold & reverse repurchase | $0 |
| Net loans and leases | $2,013,606 |
| Loan and leases loss allowance | $33,855 |
| Trading account assets | $0 |
| Bank premises and fixed assets | $45,477 |
| Other real estate owned | $2,475 |
| Goodwill and other intangibles | $25,005 |
| All other assets | $134,296 |
Liabilities
| Liabilities | Value (in 000's) |
|---|---|
| Total liabilities and capital | $3,046,940 |
| Total Liabilities | $2,693,992 |
| Total deposits | $2,584,674 |
| Interest-bearing deposits | $2,238,353 |
| Deposits held in domestic offices | $2,584,674 |
| % insured (estimated) | $73 |
| Federal funds purchased and repurchase agreements | $66,980 |
| Trading liabilities | $0 |
| Other borrowed funds | $6,393 |
| Subordinated debt | $0 |
| All other liabilities | $35,945 |
Issued Loan Types
| Type | Value (in 000's) |
|---|---|
| Net loans and leases | $2,013,606 |
| Loan and leases loss allowance | $33,855 |
| Total loans and leases (domestic) | $2,047,461 |
| All real estate loans | $1,488,170 |
| Real estate loans in domestic offices | $1,488,170 |
| Construction and development loans | $98,486 |
| Residential 1-4 family construction | $14,950 |
| Other construction, all land development and other land | $83,536 |
| Loans secured by nonfarm nonresidential properties | $898,106 |
| Nonfarm nonresidential secured by owner-occupied properties | $316,449 |
| Commercial real estate & other non-farm, non-residential | $581,657 |
| Multifamily residential real estate | $188,305 |
| 1-4 family residential loans | $286,267 |
| Farmland loans | $17,006 |
| Loans held in foreign offices | $0 |
| Farm loans | $4,991 |
| Commercial and industrial loans | $478,892 |
| To non-U.S. addressees | $0 |
| Loans to individuals | $2,545 |
| Credit card loans | $0 |
| Related Plans | $1,636 |
| Consumer Auto Loans | $660 |
| Other loans to individuals | $249 |
| All other loans & leases | $72,864 |
| Loans to foreign governments and official institutions | $0 |
| Other loans | $50,693 |
| Loans to depository institutions and acceptances of other banks | $0 |
| Loans not secured by real estate | $16,000 |
| Loans secured by real estate to non-U.S. addressees | $0 |
| Restructured Loans & leases | $331 |
| Non 1-4 family restructured loans & leases | $0 |
| Total loans and leases (foreign) | $0 |
Old Second National Bank had $2,013,606,000 of loans outstanding in 2020. $1,488,170,000 of loans were in real estate loans. $98,486,000 of loans were in development loans. $188,305,000 of loans were in multifamily mortgage loans. $286,267,000 of loans were in 1-4 family mortgage loans. $4,991,000 of loans were in farm loans. $0 of loans were in credit card loans. $660,000 of loans were in the auto loan category.
Small Business Loans
| Categorization | # of Loans in Category | $ amount of loans (in 000's) | Average $/loan |
|---|---|---|---|
| Nonfarm, nonresidential loans - <$1MM | 550 | $144,455 | $262,645 |
| Nonfarm, nonresidential loans - <$100k | 50 | $2,353 | $47,060 |
| Nonfarm, nonresidential loans - $100-250k | 179 | $22,272 | $124,425 |
| Nonfarm, nonresidential loans - $250k-1MM | 321 | $119,830 | $373,302 |
| Commercial & Industrial, US addressed loans - <$1MM | 1,296 | $182,655 | $140,938 |
| Commercial & Industrial, US addressed loans - <$100k | 448 | $12,867 | $28,721 |
| Commercial & Industrial, US addressed loans - $100-250k | 387 | $47,611 | $123,026 |
| Commercial & Industrial, US addressed loans - $250k-1MM | 461 | $122,177 | $265,026 |
| Farmland loans - <$1MM | 11 | $1,993 | $181,182 |
| Farmland loans - <$100k | 1 | $3 | $3,000 |
| Farmland loans - $100-250k | 5 | $564 | $112,800 |
| Farmland loans - $250k-1MM | 5 | $1,426 | $285,200 |
| Agriculture operations loans - <$1MM | 22 | $1,678 | $76,273 |
| Agriculture operations loans - <$100k | 9 | $65 | $7,222 |
| Agriculture operations loans - $100-250k | 10 | $793 | $79,300 |
| Agriculture operations loans - $250k-1MM | 3 | $820 | $273,333 |