Sandy Spring Bank Mortgage Rates, Fees & Info
Olney, MDLEI: 549300NQA30MEKPQP417
Tax ID: 52-0312970
Latest/2024 | 2023 Data | 2022 Data | 2021 Data | 2020 Data | 2019 Data | 2018 Data
Jump to:
Mortgage Data
Bank Data
Review & Overview
Sandy Spring Bank is a small bank specializing in Refi and Home Purchase loans. Sandy Spring Bank has a high proportion of conventional loans. They have a a low proportion of FHA loans. (This may mean they shy away from first time homebuyers.) They have a low ratio of USDA loans. Their top markets by origination volume include: Washington, Baltimore, Nashville, Salisbury, and Miami among others. We have data for 75 markets. (Some data included below & more in-depth data is available with an active subscription.)Sandy Spring Bank has an above average approval rate when compared to the average across all lenders. They have a below average pick rate when compared to similar lenders. Sandy Spring Bank is typically a low fee lender. (We use the term "fees" to include things like closing costs and other costs incurred by borrowers-- whether they are paid out of pocket or rolled into the loan.) They typically have about average rates.
We show data for every lender and do not change our ratings-- even if an organization is a paid advertiser. Our consensus data does have lag, but it is highly correlated to a lender's rates & fees relative to their markets. This means that if a bank is a low fee/rate lender the past-- chances are they are still one today. Our SimulatedRates™ use advanced statistical techniques to forecast different rates based on a lender's historical data.
Mortgage seekers: Choose your metro area here to explore the lowest fee & rate lenders.
Mortgage professionals: We have various tools to make your lives easier. Contact us to see how we can help with your market research, analytics or advertising needs.
SimulatedRates™Mortgage Type |
Simulated Rate | Simulation Date |
|---|---|---|
| Home Equity Line of Credit (HELOC) | 7.50% | 1/27/26 |
| 30 Year Conventional Purchase | 6.93% | 1/27/26 |
| 30 Year Conventional Refi | 6.82% | 1/27/26 |
| 30 Year Cash-out Refi | 7.69% | 1/27/26 |
| 30 Year FHA Purchase | 7.16% | 1/27/26 |
| 30 Year FHA Refi | 6.79% | 1/27/26 |
| 30 Year VA Purchase | 6.28% | 1/27/26 |
| 30 Year VA Refi | 5.99% | 1/27/26 |
| 30 Year USDA Purchase | 6.81% | 1/27/26 |
| 15 Year Conventional Purchase | 6.20% | 1/27/26 |
| 15 Year Conventional Refi | 6.12% | 1/27/26 |
| 15 Year Cash-out Refi | 6.12% | 1/27/26 |
| These are simulated rates generated by our proprietary machine learning models. These are not guaranteed by the bank. They are our estimates based on a lender's past behaviors combined with current market conditions. Contact an individual lender for their actual rates. Our models use fixed rate terms for conforming loans, 700+ FICO, 10% down for FHA and 20% for conventional. These are based on consensus, historical data-- not advertised promotional rates. | ||
Sandy Spring Bank Mortgage Calculator
Your Estimates
Estimated Loan Payment: Update the calculator values and click calculate payment!
This is not an official calculator from Sandy Spring Bank. It uses our SimulatedRate™
technology, basic math and reasonable assumptions to calculate mortgage payments derived from our simulations and your inputs.
The default purchase price is the median sales price across the US for 2022Q4, per FRED.
Originations
5,355Origination Dollar Volume (All Markets)
$2,330,965,000Employee count
1,153Awards
Sandy Spring Bank - 2021
Sandy Spring Bank is a 2021 , due to their low .
For 2021, less than of lenders were eligible for this award.
Work for Sandy Spring Bank?
Use this award on your own site. Either save and use the images below, or pass the provided image embed code to your development team.
Top Markets
Zoom/scroll map to see bank's per metro statistics. Subscribers can configure state/metro/county granularity, assorted fields and quantity of results. This map shows top 10 markets in the map viewport, as defined by descending origination volume.
| Market | Originations | Total Value | Average Loan | Average Fees | Average Rate |
|---|---|---|---|---|---|
| Washington-Arlington-Alexandria, DC-VA-MD-WV (FHA|USDA|VA) | 3,677 | $1,641,605,000 | $446,452 | $5,743 | 3.09% |
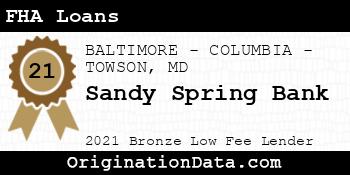
| BALTIMORE-COLUMBIA-TOWSON, MD (FHA|USDA|VA) | 1,302 | $470,310,000 | $361,221 | $5,192 | 3.16% |
| NASHVILLE-DAVIDSON-MURFREESBORO-FRANKLIN, TN (FHA|USDA|VA) | 3 | $53,255,000 | $17,751,667 | $3,802 | 2.86% |
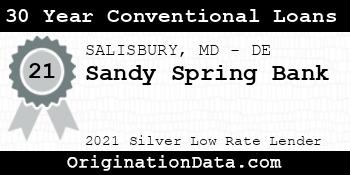
| SALISBURY, MD-DE (FHA|USDA|VA) | 71 | $27,515,000 | $387,535 | $4,862 | 2.93% |
| Miami-Fort Lauderdale-Pompano Beach, FL (FHA|USDA|VA) | 17 | $17,805,000 | $1,047,353 | $7,569 | 2.95% |
| FAYETTEVILLE, NC (FHA|USDA|VA) | 2 | $15,410,000 | $7,705,000 | $0 | 2.99% |
| Outside of Metro Areas | 36 | $14,850,000 | $412,500 | $5,673 | 3.04% |
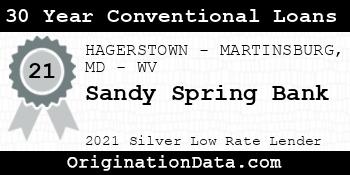
| HAGERSTOWN-MARTINSBURG, MD-WV (FHA|USDA|VA) | 34 | $11,210,000 | $329,706 | $4,803 | 3.02% |
| RICHMOND, VA (FHA|USDA|VA) | 25 | $9,885,000 | $395,400 | $5,365 | 2.79% |
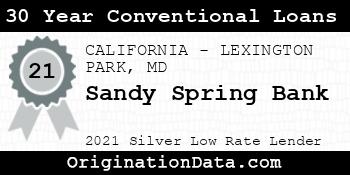
| CALIFORNIA-LEXINGTON PARK, MD (FHA|USDA|VA) | 21 | $7,505,000 | $357,381 | $5,612 | 2.99% |
| Philadelphia-Camden-Wilmington, PA-NJ-DE-MD (FHA|USDA|VA) | 16 | $5,940,000 | $371,250 | $5,336 | 3.07% |
| NAPLES-MARCO ISLAND, FL (FHA|USDA|VA) | 3 | $4,335,000 | $1,445,000 | $8,375 | 2.71% |
| VIRGINIA BEACH-NORFOLK-NEWPORT NEWS, VA-NC (FHA|USDA|VA) | 13 | $3,945,000 | $303,462 | $4,097 | 3.15% |
| ATLANTA-SANDY SPRINGS-ALPHARETTA, GA (FHA|USDA|VA) | 7 | $3,255,000 | $465,000 | $4,960 | 2.84% |
| Kill Devil Hills, NC (FHA|USDA|VA) | 4 | $2,910,000 | $727,500 | $2,972 | 2.97% |
| WINCHESTER, VA-WV (FHA|USDA|VA) | 3 | $2,885,000 | $961,667 | $5,383 | 3.36% |
| Easton, MD (FHA|USDA|VA) | 8 | $2,500,000 | $312,500 | $5,157 | 3.20% |
| CHARLOTTESVILLE, VA (FHA|USDA|VA) | 9 | $2,325,000 | $258,333 | $3,567 | 2.99% |
| DENVER-AURORA-LAKEWOOD, CO (FHA|USDA|VA) | 4 | $2,040,000 | $510,000 | $5,556 | 2.94% |
| ORLANDO-KISSIMMEE-SANFORD, FL (FHA|USDA|VA) | 7 | $1,785,000 | $255,000 | $4,003 | 2.73% |
| New York-Newark-Jersey City, NY-NJ-PA (FHA|USDA|VA) | 1 | $1,755,000 | $1,755,000 | $0 | 4.10% |
| JACKSONVILLE, FL (FHA|USDA|VA) | 6 | $1,670,000 | $278,333 | $5,007 | 2.73% |
| North Port-Sarasota-Bradenton, FL (FHA|USDA|VA) | 4 | $1,610,000 | $402,500 | $5,857 | 3.03% |
| TAMPA-ST. PETERSBURG-CLEARWATER, FL (FHA|USDA|VA) | 6 | $1,580,000 | $263,333 | $5,573 | 2.85% |
| MYRTLE BEACH-CONWAY-NORTH MYRTLE BEACH, SC-NC (FHA|USDA|VA) | 6 | $1,360,000 | $226,667 | $3,718 | 2.73% |
| GREENVILLE-ANDERSON, SC (FHA|USDA|VA) | 3 | $1,175,000 | $391,667 | $3,610 | 3.21% |
| Key West, FL (FHA|USDA|VA) | 1 | $1,145,000 | $1,145,000 | $18,349 | 3.25% |
| CAPE CORAL-FORT MYERS, FL (FHA|USDA|VA) | 2 | $1,100,000 | $550,000 | $6,752 | 2.63% |
| ROANOKE, VA (FHA|USDA|VA) | 2 | $1,090,000 | $545,000 | $5,041 | 2.50% |
| CHARLESTON-NORTH CHARLESTON, SC (FHA|USDA|VA) | 2 | $910,000 | $455,000 | $7,265 | 2.69% |
| PITTSBURGH, PA (FHA|USDA|VA) | 3 | $865,000 | $288,333 | $4,169 | 3.00% |
| DAYTON-KETTERING, OH (FHA|USDA|VA) | 2 | $840,000 | $420,000 | $3,628 | 2.50% |
| HARRISONBURG, VA (FHA|USDA|VA) | 2 | $720,000 | $360,000 | $6,898 | 3.13% |
| YORK-HANOVER, PA (FHA|USDA|VA) | 3 | $715,000 | $238,333 | $5,241 | 2.83% |
| Glenwood Springs, CO (FHA|USDA|VA) | 1 | $645,000 | $645,000 | $3,389 | 3.00% |
| DELTONA-DAYTONA BEACH-ORMOND BEACH, FL (FHA|USDA|VA) | 1 | $645,000 | $645,000 | $6,160 | 3.25% |
| DURHAM-CHAPEL HILL, NC (FHA|USDA|VA) | 3 | $585,000 | $195,000 | $2,407 | 3.00% |
| Cambridge, MD (FHA|USDA|VA) | 1 | $565,000 | $565,000 | $4,885 | 3.13% |
| COLORADO SPRINGS, CO (FHA|USDA|VA) | 2 | $550,000 | $275,000 | $4,435 | 2.69% |
| GETTYSBURG, PA (FHA|USDA|VA) | 2 | $510,000 | $255,000 | $2,882 | 3.04% |
| HILTON HEAD ISLAND-BLUFFTON, SC (FHA|USDA|VA) | 1 | $505,000 | $505,000 | $4,337 | 2.50% |
| Georgetown, SC (FHA|USDA|VA) | 1 | $485,000 | $485,000 | $4,537 | 2.88% |
| CHARLOTTE-CONCORD-GASTONIA, NC-SC (FHA|USDA|VA) | 2 | $480,000 | $240,000 | $3,088 | 2.44% |
| THE VILLAGES, FL (FHA|USDA|VA) | 2 | $480,000 | $240,000 | $3,605 | 3.00% |
| RALEIGH-CARY, NC (FHA|USDA|VA) | 1 | $475,000 | $475,000 | $5,719 | 2.25% |
| READING, PA (FHA|USDA|VA) | 1 | $435,000 | $435,000 | $11,630 | 2.88% |
| STAUNTON, VA (FHA|USDA|VA) | 2 | $410,000 | $205,000 | $3,486 | 3.06% |
| LAKELAND-WINTER HAVEN, FL (FHA|USDA|VA) | 1 | $405,000 | $405,000 | $6,895 | 4.13% |
| BOULDER, CO (FHA|USDA|VA) | 1 | $405,000 | $405,000 | $3,583 | 2.75% |
| LYNCHBURG, VA (FHA|USDA|VA) | 1 | $355,000 | $355,000 | $3,836 | 3.00% |
| CINCINNATI, OH-KY-IN (FHA|USDA|VA) | 1 | $335,000 | $335,000 | $3,861 | 3.25% |
| Shelby, NC (FHA|USDA|VA) | 1 | $325,000 | $325,000 | $3,862 | 2.13% |
| COLUMBUS, OH (FHA|USDA|VA) | 1 | $325,000 | $325,000 | $4,238 | 3.38% |
| CUMBERLAND, MD-WV (FHA|USDA|VA) | 2 | $300,000 | $150,000 | $4,181 | 2.81% |
| COLUMBIA, SC (FHA|USDA|VA) | 1 | $295,000 | $295,000 | $6,978 | 2.50% |
| Elizabeth City, NC (FHA|USDA|VA) | 1 | $295,000 | $295,000 | $4,292 | 2.25% |
| LANCASTER, PA (FHA|USDA|VA) | 1 | $275,000 | $275,000 | $3,539 | 2.25% |
| PORT ST. LUCIE, FL (FHA|USDA|VA) | 1 | $275,000 | $275,000 | $4,084 | 2.75% |
| KINGSPORT-BRISTOL, TN-VA (FHA|USDA|VA) | 1 | $265,000 | $265,000 | $4,178 | 2.50% |
| GREELEY, CO (FHA|USDA|VA) | 1 | $225,000 | $225,000 | $2,137 | 2.50% |
| CRESTVIEW-FORT WALTON BEACH-DESTIN, FL (FHA|USDA|VA) | 1 | $215,000 | $215,000 | $8,473 | 2.88% |
| CLEVELAND-ELYRIA, OH (FHA|USDA|VA) | 2 | $200,000 | $100,000 | $3,424 | 3.63% |
| MORGANTOWN, WV (FHA|USDA|VA) | 1 | $185,000 | $185,000 | $2,775 | 2.13% |
| ALLENTOWN-BETHLEHEM-EASTON, PA-NJ (FHA|USDA|VA) | 1 | $185,000 | $185,000 | $3,771 | 2.88% |
| HARRISBURG-CARLISLE, PA (FHA|USDA|VA) | 1 | $185,000 | $185,000 | $3,458 | 2.63% |
| ATHENS-CLARKE COUNTY, GA (FHA|USDA|VA) | 1 | $175,000 | $175,000 | $4,986 | 4.13% |
| GREENSBORO-HIGH POINT, NC (FHA|USDA|VA) | 1 | $175,000 | $175,000 | $4,191 | 4.88% |
| EAST STROUDSBURG, PA (FHA|USDA|VA) | 1 | $175,000 | $175,000 | $4,482 | 2.50% |
| STATE COLLEGE, PA (FHA|USDA|VA) | 1 | $165,000 | $165,000 | $3,384 | 2.50% |
| JACKSONVILLE, NC (FHA|USDA|VA) | 1 | $135,000 | $135,000 | $3,375 | 2.38% |
| Kinston, NC (FHA|USDA|VA) | 1 | $125,000 | $125,000 | $5,742 | 4.88% |
| CHATTANOOGA, TN-GA (FHA|USDA|VA) | 1 | $125,000 | $125,000 | $1,848 | 2.88% |
| SCRANTON--WILKES-BARRE, PA (FHA|USDA|VA) | 1 | $125,000 | $125,000 | $6,282 | 3.25% |
| Wilson, NC (FHA|USDA|VA) | 1 | $85,000 | $85,000 | $5,330 | 4.50% |
| FLORENCE, SC (FHA|USDA|VA) | 1 | $55,000 | $55,000 | $3,454 | 4.38% |
Similar Lenders
We use machine learning to identify the top lenders compared against Sandy Spring Bank based on their rates and fees, along with other useful metrics. A lower similarity rank signals a stronger match.
Similarity Rank: 167
Similarity Rank: 228
Similarity Rank: 279
Similarity Rank: 410
Similarity Rank: 420
Similarity Rank: 476
Similarity Rank: 477
Similarity Rank: 504
Similarity Rank: 544
Similarity Rank: 632
Product Mix
For 2021, Sandy Spring Bank's most frequently originated type of loan was Conventional, with 3,999 originations. Their 2nd most popular type was HELOC, with 949 originations.
Loan Reason
For 2021, Sandy Spring Bank's most frequently cited loan purpose was Refi, with 2,072 originations. The 2nd most popular reason was Home Purchase, with 1,895 originations.
Loan Duration/Length
For 2021, Sandy Spring Bank's most frequently cited loan duration was 30 Year, with 3,347 originations. The 2nd most popular length was 30+ year, with 1,194 originations.
Origination Fees/Closing Costs
Sandy Spring Bank's average total fees were $5,363, while their most frequently occuring range of origination fees (closing costs) were in the $1k-2k bucket, with 2,995 originations.
Interest Rates
During 2021, Sandy Spring Bank's average interest rate for loans was 2.97%, while their most frequently originated rate bucket for loans was 2.5-3%, with 2,275 originations.
Loan Sizing
2021 saw Sandy Spring Bank place emphasis on $200k-400k loans with 1,902 originations, totaling $557,820,000 in origination value.
Applicant Income
Sandy Spring Bank lent most frequently to those with incomes in the $150k-250k range, with 1,327 originations. The second most popular income band? $250k+, with 1,165 originations.
Applicant Debt to Income Ratio
Sandy Spring Bank lent most frequently to those with DTI ratios of 20-30%, with 1,231 originations. The next most common DTI ratio? 30-36%, with 953 originations.
Ethnicity Mix
Approval Rates
Total approvals of all applications91.36%
Sandy Spring Bank has an average approval rate.
Pick Rate
Approvals leading to origination85.14%
Sandy Spring Bank has an average pick rate.
Points and Fees
| Points | Originations | Total Value | Average Loan |
|---|---|---|---|
| NA | 5,355 | $2,330,965,000 | $435,288 |
Occupancy Type Mix
| Dwelling Type | Originations | Total Value | Average Loan |
|---|---|---|---|
| 5,355 | $2,330,965,000 | $435,288 |
LTV Distribution
Complaints
| Bank Name | Product | Issue | 2021 CPFB Complaints | % of Total Issues |
|---|---|---|---|---|
| SANDY SPRING BANCORP, INC. | FHA mortgage | Closing on a mortgage | 1 | 20.0% |
| SANDY SPRING BANCORP, INC. | Home equity loan or line of credit (HELOC) | Applying for a mortgage or refinancing an existing mortgage | 1 | 20.0% |
| SANDY SPRING BANCORP, INC. | Home equity loan or line of credit (HELOC) | Problem with a credit reporting company's investigation into an existing problem | 1 | 20.0% |
| SANDY SPRING BANCORP, INC. | Other type of mortgage | Applying for a mortgage or refinancing an existing mortgage | 1 | 20.0% |
| SANDY SPRING BANCORP, INC. | Other type of mortgage | Closing on a mortgage | 1 | 20.0% |
Bank Details
Branches
| Bank Name | Branch | Branch Type | Deposits (000's) |
|---|---|---|---|
| Sandy Spring Bank | 1 Ashton Road Ashton, MD 20861 | Full Service B&M | $172,538 |
| Sandy Spring Bank | 1 Catoctin Circle Ne Leesburg, VA 20176 | Full Service B&M | $82,377 |
| Sandy Spring Bank | 1003 West Patrick Street Frederick, MD 21702 | Full Service B&M | $65,856 |
| Sandy Spring Bank | 1025 Connecticut Avenue, N.W., 1st Floor Washington, DC 20036 | Full Service B&M | $80,650 |
| Sandy Spring Bank | 10329 Old Georgetown Road Bethesda, MD 20816 | Full Service B&M | $186,164 |
| Sandy Spring Bank | 10985 Baltimore Avenue Beltsville, MD 20705 | Full Service B&M | $11,016 |
| Sandy Spring Bank | 1146 - 19th Street, N.W. Washington, DC 20036 | Full Service B&M | $51,942 |
| Sandy Spring Bank | 115 North Washington Street Alexandria, VA 22314 | Full Service B&M | $19,025 |
| Sandy Spring Bank | 11636 Plaza America Drive Reston, VA 20190 | Full Service B&M | $245,951 |
| Sandy Spring Bank | 116_mitchells Chance Road Edgewater, MD 21037 | Full Service B&M | $172,434 |
| Sandy Spring Bank | 12276 Clarksville Pike Clarksville, MD 21029 | Full Service B&M | $415,680 |
| Sandy Spring Bank | 12735 Shoppes Lane Fairfax, VA 22033 | Full Service B&M | $318,637 |
| Sandy Spring Bank | 1299 Pennsylvania Avenue, Nw Washington, DC 20004 | Full Service B&M | $16,381 |
| Sandy Spring Bank | 13081 Worldgate Drive Herndon, VA 20170 | Full Service B&M | $54,416 |
| Sandy Spring Bank | 13300 New Hampshire Avenue Colesville, MD 20904 | Full Service B&M | $281,343 |
| Sandy Spring Bank | 1356 Chain Bridge Road Mclean, VA 22101 | Full Service B&M | $41,653 |
| Sandy Spring Bank | 14 West Patrick Street Frederick, MD 21701 | Full Service B&M | $236,482 |
| Sandy Spring Bank | 14241 Layhill Road Silver Spring, MD 20906 | Full Service B&M | $132,127 |
| Sandy Spring Bank | 14404 Baltimore Avenue Laurel, MD 20707 | Full Service B&M | $140,700 |
| Sandy Spring Bank | 14941 Shady Grove Road Rockville, MD 20850 | Full Service B&M | $41,756 |
| Sandy Spring Bank | 166 Jennifer Road Annapolis, MD 21401 | Full Service B&M | $283,365 |
| Sandy Spring Bank | 17801 Georgia Avenue Olney, MD 20832 | Full Service B&M | $0 |
| Sandy Spring Bank | 17801 Georgia Avenue Olney, MD 20832 | Full Service B&M | $2,513,356 |
| Sandy Spring Bank | 19460 Golf Vista Plaza Leesburg, VA 20176 | Full Service B&M | $42,575 |
| Sandy Spring Bank | 20930 Frederick Road Germantown, MD 20876 | Full Service B&M | $107,573 |
| Sandy Spring Bank | 2095 Chain Bridge Road Vienna, VA 22182 | Full Service B&M | $107,292 |
| Sandy Spring Bank | 2101 Gaither Road Rockville, MD 20850 | Full Service B&M | $79,720 |
| Sandy Spring Bank | 26250 Ridge Road Damascus, MD 20872 | Full Service B&M | $149,958 |
| Sandy Spring Bank | 319 Main Street Laurel, MD 20707 | Full Service B&M | $327,077 |
| Sandy Spring Bank | 3535 Spencerville Road Burtonsville, MD 20866 | Full Service B&M | $197,272 |
| Sandy Spring Bank | 3701 International Drive Silver Spring, MD 20906 | Full Service B&M | $46 |
| Sandy Spring Bank | 3801 International Drive Silver Spring, MD 20906 | Full Service B&M | $155,597 |
| Sandy Spring Bank | 4001 Mountain Road Pasadena, MD 21122 | Full Service B&M | $104,622 |
| Sandy Spring Bank | 409 Russell Avenue Gaithersburg, MD 20877 | Full Service B&M | $34,323 |
| Sandy Spring Bank | 425 East Ridgeville Blvd Mount Airy, MD 21771 | Full Service B&M | $78,336 |
| Sandy Spring Bank | 4501 N Fairfax Drive Arlington, VA 22203 | Full Service B&M | $39,452 |
| Sandy Spring Bank | 484 N Frederick Avenue Gaithersburg, MD 20877 | Full Service B&M | $357,481 |
| Sandy Spring Bank | 502 Washington Avenue, Suite 103 Towson, MD 21204 | Full Service B&M | $205,892 |
| Sandy Spring Bank | 5250 Port Roayal Road Springfield, VA 22151 | Full Service B&M | $60,092 |
| Sandy Spring Bank | 6031 University Boulevard Ellicott City, MD 21043 | Full Service B&M | $320,577 |
| Sandy Spring Bank | 6089 Oxon Hill Road Oxon Hill, MD 20745 | Full Service B&M | $38,632 |
| Sandy Spring Bank | 611 Rockville Pike Rockville, MD 20852 | Full Service B&M | $753,169 |
| Sandy Spring Bank | 6329 Greenbelt Road College Park, MD 20740 | Full Service B&M | $58,932 |
| Sandy Spring Bank | 647 New York Avenue, Nw Washington, DC 20001 | Full Service B&M | $450 |
| Sandy Spring Bank | 6560 Mercantile Drive, East Frederick, MD 21703 | Full Service B&M | $54,182 |
| Sandy Spring Bank | 704 Lisbon Center Drive Woodbine, MD 21797 | Full Service B&M | $157,158 |
| Sandy Spring Bank | 7405 Ritchie Highway Glen Burnie, MD 21060 | Full Service B&M | $163,032 |
| Sandy Spring Bank | 7550 Wisconsin Avenue Suite 100 Bethesda, MD 20814 | Full Service B&M | $368,711 |
| Sandy Spring Bank | 7653 Lindbergh Drive Gaithersburg, MD 20879 | Full Service B&M | $266,519 |
| Sandy Spring Bank | 8315 Ice Crystal Drive Laurel, MD 20723 | Full Service B&M | $91,068 |
| Sandy Spring Bank | 8401 Colesville Road Silver Spring, MD 20910 | Full Service B&M | $134,437 |
| Sandy Spring Bank | 8529 Veteran's Highway Millersville, MD 21108 | Full Service B&M | $268,662 |
| Sandy Spring Bank | 8921 Fingerboard Road Frederick, MD 21704 | Full Service B&M | $73,846 |
| Sandy Spring Bank | 9113 Manassas Drive Manassas Park, VA 20111 | Full Service B&M | $87,672 |
| Sandy Spring Bank | 9707 Old Georgetown Road Bethesda, MD 20814 | Full Service B&M | $11,800 |
| Sandy Spring Bank | 9812 Falls Road Ste 125 Potomac, MD 20854 | Full Service B&M | $109,368 |
| Sandy Spring Bank | 9851 Georgetown Pike Great Falls, VA 22066 | Full Service B&M | $64,705 |
| Sandy Spring Bank | 9910 Main Street Fairfax, VA 22031 | Full Service B&M | $239,720 |
| Sandy Spring Bank | 9921 Stedwick Road Gaithersburg, MD 20879 | Full Service B&M | $80,320 |
For 2021, Sandy Spring Bank had 59 branches.
Yearly Performance Overview
Bank Income
| Item | Value (in 000's) |
|---|---|
| Total interest income | $449,956 |
| Net interest income | $430,848 |
| Total noninterest income | $100,959 |
| Gross Fiduciary activities income | $14,399 |
| Service charges on deposit accounts | $8,763 |
| Trading account gains and fees | $0 |
| Additional Noninterest Income | $77,797 |
| Pre-tax net operating income | $319,370 |
| Securities gains (or losses, -) | $213 |
| Income before extraordinary items | $241,467 |
| Discontinued Operations (Extraordinary gains, net) | $0 |
| Net income of bank and minority interests | $241,467 |
| Minority interest net income | $0 |
| Net income | $241,467 |
| Sale, conversion, retirement of capital stock, net | $5,299 |
| Net operating income | $241,298 |
Sandy Spring Bank's gross interest income from loans was $449,956,000.
Sandy Spring Bank's net interest income from loans was $430,848,000.
Sandy Spring Bank's fee based income from loans was $8,763,000.
Sandy Spring Bank's net income from loans was $241,467,000.
Bank Expenses
| Item | Value (in 000's) |
|---|---|
| Total interest expense | $19,108 |
| Provision for credit losses | $-46,792 |
| Total noninterest expense | $259,229 |
| Salaries and employee benefits | $155,506 |
| Premises and equipment expense | $34,545 |
| Additional noninterest expense | $69,178 |
| Applicable income taxes | $78,116 |
| Net charge-offs | $10,669 |
| Cash dividends | $189,172 |
Sandy Spring Bank's interest expense for loans was $19,108,000.
Sandy Spring Bank's payroll and benefits expense were $155,506,000.
Sandy Spring Bank's property, plant and equipment expenses $34,545,000.
Loan Performance
| Type of Loan | % of Loans Noncurrent (30+ days, end of period snapshot) |
|---|---|
| All loans | 0.0% |
| Real Estate loans | 0.0% |
| Construction & Land Development loans | 0.0% |
| Nonfarm, nonresidential loans | 0.0% |
| Multifamily residential loans | 0.0% |
| 1-4 family residential loans | 0.0% |
| HELOC loans | 0.0% |
| All other family | 0.0% |
| Commercial & industrial loans | 0.0% |
| Personal loans | 0.0% |
| Credit card loans | 0.0% |
| Other individual loans | 0.0% |
| Auto loans | 1.0% |
| Other consumer loans | 0.0% |
| Unsecured commercial real estate loans | 0.0% |
Deposits
| Type | Value (in 000's) |
|---|---|
| Total deposits | $10,683,782 |
| Deposits held in domestic offices | $10,683,782 |
| Deposits by Individuals, partnerships, and corporations | $10,165,579 |
| Deposits by U.S. Government | $0 |
| Deposits by States and political subdivisions in the U.S. | $298,765 |
| Deposits by Commercial banks and other depository institutions in U.S. | $219,438 |
| Deposits by Banks in foreign countries | $0 |
| Deposits by Foreign governments and official institutions | $0 |
| Transaction accounts | $5,384,357 |
| Demand deposits | $4,062,973 |
| Nontransaction accounts | $5,299,425 |
| Money market deposit accounts (MMDAs) | $3,474,701 |
| Other savings deposits (excluding MMDAs) | $533,862 |
| Total time deposits | $1,290,862 |
| Total time and savings deposits | $6,620,809 |
| Noninterest-bearing deposits | $3,779,643 |
| Interest-bearing deposits | $6,904,139 |
| Retail deposits | $9,804,718 |
| IRAs and Keogh plan accounts | $113,718 |
| Brokered deposits | $528,726 |
| Deposits held in foreign offices | $0 |
Assets
| Asset | Value (in 000's) |
|---|---|
| Total Assets | $12,586,611 |
| Cash & Balances due from depository institutions | $419,708 |
| Interest-bearing balances | $354,078 |
| Total securities | $1,465,896 |
| Federal funds sold & reverse repurchase | $312 |
| Net loans and leases | $9,897,358 |
| Loan and leases loss allowance | $109,143 |
| Trading account assets | $0 |
| Bank premises and fixed assets | $116,608 |
| Other real estate owned | $1,034 |
| Goodwill and other intangibles | $395,271 |
| All other assets | $290,424 |
Liabilities
| Liabilities | Value (in 000's) |
|---|---|
| Total liabilities and capital | $12,586,611 |
| Total Liabilities | $10,966,179 |
| Total deposits | $10,683,782 |
| Interest-bearing deposits | $6,904,139 |
| Deposits held in domestic offices | $10,683,782 |
| % insured (estimated) | $50 |
| Federal funds purchased and repurchase agreements | $151,086 |
| Trading liabilities | $0 |
| Other borrowed funds | $0 |
| Subordinated debt | $0 |
| All other liabilities | $131,311 |
Issued Loan Types
| Type | Value (in 000's) |
|---|---|
| Net loans and leases | $9,897,358 |
| Loan and leases loss allowance | $109,143 |
| Total loans and leases (domestic) | $10,006,501 |
| All real estate loans | $8,636,549 |
| Real estate loans in domestic offices | $8,636,549 |
| Construction and development loans | $1,378,243 |
| Residential 1-4 family construction | $685,129 |
| Other construction, all land development and other land | $693,114 |
| Loans secured by nonfarm nonresidential properties | $4,782,167 |
| Nonfarm nonresidential secured by owner-occupied properties | $1,658,156 |
| Commercial real estate & other non-farm, non-residential | $3,124,011 |
| Multifamily residential real estate | $573,702 |
| 1-4 family residential loans | $1,876,536 |
| Farmland loans | $25,901 |
| Loans held in foreign offices | $0 |
| Farm loans | $0 |
| Commercial and industrial loans | $1,207,240 |
| To non-U.S. addressees | $0 |
| Loans to individuals | $30,488 |
| Credit card loans | $0 |
| Related Plans | $23,124 |
| Consumer Auto Loans | $2,638 |
| Other loans to individuals | $4,726 |
| All other loans & leases | $132,224 |
| Loans to foreign governments and official institutions | $0 |
| Other loans | $128,356 |
| Loans to depository institutions and acceptances of other banks | $0 |
| Loans not secured by real estate | $100 |
| Loans secured by real estate to non-U.S. addressees | $0 |
| Restructured Loans & leases | $1,684 |
| Non 1-4 family restructured loans & leases | $614 |
| Total loans and leases (foreign) | $0 |
Sandy Spring Bank had $9,897,358,000 of loans outstanding in 2021. $8,636,549,000 of loans were in real estate loans. $1,378,243,000 of loans were in development loans. $573,702,000 of loans were in multifamily mortgage loans. $1,876,536,000 of loans were in 1-4 family mortgage loans. $0 of loans were in farm loans. $0 of loans were in credit card loans. $2,638,000 of loans were in the auto loan category.
Small Business Loans
| Categorization | # of Loans in Category | $ amount of loans (in 000's) | Average $/loan |
|---|---|---|---|
| Nonfarm, nonresidential loans - <$1MM | 1,739 | $602,665 | $346,558 |
| Nonfarm, nonresidential loans - <$100k | 87 | $3,313 | $38,080 |
| Nonfarm, nonresidential loans - $100-250k | 404 | $50,554 | $125,134 |
| Nonfarm, nonresidential loans - $250k-1MM | 1,248 | $548,798 | $439,742 |
| Commercial & Industrial, US addressed loans - <$1MM | 5,199 | $489,791 | $94,209 |
| Commercial & Industrial, US addressed loans - <$100k | 2,442 | $53,798 | $22,030 |
| Commercial & Industrial, US addressed loans - $100-250k | 1,022 | $85,876 | $84,027 |
| Commercial & Industrial, US addressed loans - $250k-1MM | 1,735 | $350,117 | $201,797 |
| Farmland loans - <$1MM | 11 | $3,494 | $317,636 |
| Farmland loans - $100-250k | 2 | $385 | $192,500 |
| Farmland loans - $250k-1MM | 9 | $3,109 | $345,444 |