Associated Bank Mortgage Rates, Fees & Info
Green Bay, WILEI: ZF85QS7OXKPBG52R7N18
Tax ID: 39-1941673
Latest/2024 | 2023 Data | 2022 Data | 2021 Data | 2020 Data | 2019 Data | 2018 Data
Jump to:
Mortgage Data
Review & Overview
Associated Bank is a small bank specializing in Home Purchase loans. Associated Bank has a high proportion of conventional loans. They have a a low proportion of FHA loans. (This may mean they shy away from first time homebuyers.) They have a low ratio of USDA loans. Their top markets by origination volume include: Chicago, Milwaukee, Minneapolis, Green Bay, and Dallas among others. We have data for 92 markets. (Some data included below & more in-depth data is available with an active subscription.)Associated Bank has an average approval rate when compared to the average across all lenders. They have a below average pick rate when compared to similar lenders. Associated Bank is typically a low fee lender. (We use the term "fees" to include things like closing costs and other costs incurred by borrowers-- whether they are paid out of pocket or rolled into the loan.) They typically have relatively high rates.
We show data for every lender and do not change our ratings-- even if an organization is a paid advertiser. Our consensus data does have lag, but it is highly correlated to a lender's rates & fees relative to their markets. This means that if a bank is a low fee/rate lender the past-- chances are they are still one today. Our SimulatedRates™ use advanced statistical techniques to forecast different rates based on a lender's historical data.
Mortgage seekers: Choose your metro area here to explore the lowest fee & rate lenders.
Mortgage professionals: We have various tools to make your lives easier. Contact us to see how we can help with your market research, analytics or advertising needs.
SimulatedRates™Mortgage Type |
Simulated Rate | Simulation Date |
|---|---|---|
| Home Equity Line of Credit (HELOC) | 6.72% | 1/26/26 |
| 30 Year Conventional Purchase | 6.70% | 1/26/26 |
| 30 Year Conventional Refi | 6.67% | 1/26/26 |
| 30 Year Cash-out Refi | 6.90% | 1/26/26 |
| 30 Year FHA Purchase | 7.11% | 1/26/26 |
| 30 Year FHA Refi | 6.72% | 1/26/26 |
| 30 Year VA Purchase | 6.58% | 1/26/26 |
| 30 Year USDA Purchase | 6.89% | 1/26/26 |
| 15 Year Conventional Purchase | 6.01% | 1/26/26 |
| 15 Year Conventional Refi | 6.14% | 1/26/26 |
| 15 Year Cash-out Refi | 6.14% | 1/26/26 |
| These are simulated rates generated by our proprietary machine learning models. These are not guaranteed by the bank. They are our estimates based on a lender's past behaviors combined with current market conditions. Contact an individual lender for their actual rates. Our models use fixed rate terms for conforming loans, 700+ FICO, 10% down for FHA and 20% for conventional. These are based on consensus, historical data-- not advertised promotional rates. | ||
Associated Bank Mortgage Calculator
Your Estimates
Estimated Loan Payment: Update the calculator values and click calculate payment!
This is not an official calculator from Associated Bank. It uses our SimulatedRate™
technology, basic math and reasonable assumptions to calculate mortgage payments derived from our simulations and your inputs.
The default purchase price is the median sales price across the US for 2022Q4, per FRED.
Originations
6,532Origination Dollar Volume (All Markets)
$2,022,920,000Awards


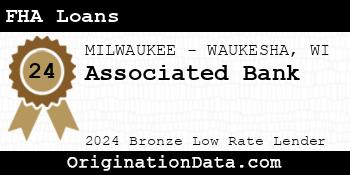
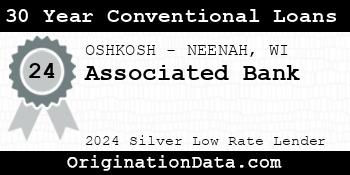

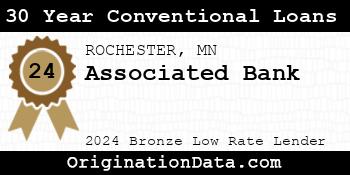
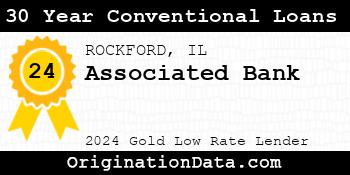

Associated Bank - 2024
Associated Bank is a 2024 , due to their low .
For 2024, less than of lenders were eligible for this award.
Work for Associated Bank?
Use this award on your own site. Either save and use the images below, or pass the provided image embed code to your development team.
Relative Rate
Associated Bank's average 30 year fixed mortgage rate was
7.64%.
The 2024 average 30 year fixed rate mortgage across all markets and lenders was 6.55%.
This yields a difference of 1.09%.
Relative Fees (Closing Costs)
Associated Bank's average total fees/closing costs for a 30 year fixed rate
mortgage were $3,422.
The average total origination fees for 30 year fixed rate mortgages across all lenders (for all loan values, including
both points & up-front fees in addition to origination fees) were $8,356.
Top Markets
Zoom/scroll map to see bank's per metro statistics. Subscribers can configure state/metro/county granularity, assorted fields and quantity of results. This map shows top 10 markets in the map viewport, as defined by descending origination volume.
| Market | Originations | Total Value | Average Loan | Average Fees | Average Rate |
|---|---|---|---|---|---|
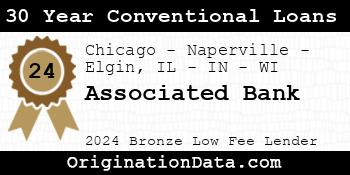
| Chicago-Naperville-Elgin, IL-IN-WI (FHA|USDA|VA) | 771 | $318,735,000 | $413,405 | $5,568 | 7.33% |
| MILWAUKEE-WAUKESHA, WI (FHA|USDA|VA) | 1,236 | $291,740,000 | $236,036 | $2,707 | 7.55% |
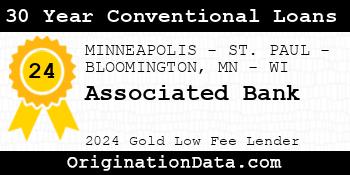
| MINNEAPOLIS-ST. PAUL-BLOOMINGTON, MN-WI (FHA|USDA|VA) | 597 | $249,275,000 | $417,546 | $3,796 | 7.52% |
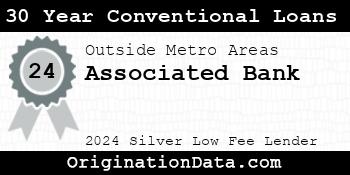
| Outside of Metro Areas | 545 | $124,885,000 | $229,147 | $2,892 | 7.79% |
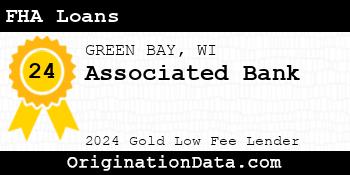
| GREEN BAY, WI (FHA|USDA|VA) | 618 | $118,620,000 | $191,942 | $2,603 | 7.60% |
| Dallas-Fort Worth-Arlington, TX (FHA|USDA|VA) | 4 | $106,770,000 | $26,692,500 | $0 | 8.08% |
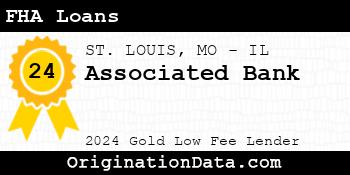
| ST. LOUIS, MO-IL (FHA|USDA|VA) | 284 | $83,030,000 | $292,359 | $4,526 | 7.54% |
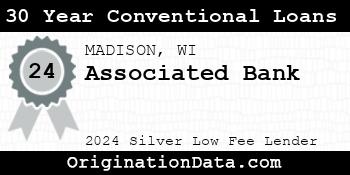
| MADISON, WI (FHA|USDA|VA) | 279 | $53,745,000 | $192,634 | $2,635 | 7.92% |
| INDIANAPOLIS-CARMEL-ANDERSON, IN (FHA|USDA|VA) | 7 | $51,855,000 | $7,407,857 | $2,321 | 6.95% |
| APPLETON, WI (FHA|USDA|VA) | 232 | $42,010,000 | $181,078 | $2,550 | 7.63% |
| RACINE, WI (FHA|USDA|VA) | 127 | $41,645,000 | $327,913 | $2,712 | 7.43% |
| VALLEJO, CA (FHA|USDA|VA) | 1 | $35,005,000 | $35,005,000 | $0 | 7.32% |
| KANSAS CITY, MO-KS (FHA|USDA|VA) | 3 | $33,665,000 | $11,221,667 | $13,769 | 7.03% |
| WORCESTER, MA-CT (FHA|USDA|VA) | 1 | $32,175,000 | $32,175,000 | $0 | 7.44% |
| AUSTIN-ROUND ROCK-GEORGETOWN, TX (FHA|USDA|VA) | 1 | $30,475,000 | $30,475,000 | $0 | 7.54% |
| ATLANTA-SANDY SPRINGS-ALPHARETTA, GA (FHA|USDA|VA) | 1 | $30,005,000 | $30,005,000 | $0 | 7.33% |
| North Port-Sarasota-Bradenton, FL (FHA|USDA|VA) | 6 | $28,710,000 | $4,785,000 | $4,569 | 6.93% |
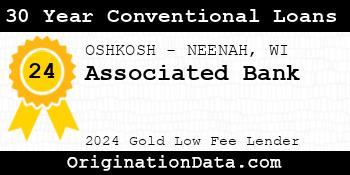
| OSHKOSH-NEENAH, WI (FHA|USDA|VA) | 153 | $27,005,000 | $176,503 | $2,582 | 7.37% |
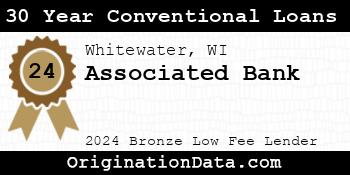
| Whitewater, WI (FHA|USDA|VA) | 112 | $26,770,000 | $239,018 | $3,088 | 7.93% |
| CINCINNATI, OH-KY-IN (FHA|USDA|VA) | 2 | $25,160,000 | $12,580,000 | $0 | 8.36% |
| Washington-Arlington-Alexandria, DC-VA-MD-WV (FHA|USDA|VA) | 1 | $23,435,000 | $23,435,000 | $0 | 7.82% |
| EAU CLAIRE, WI (FHA|USDA|VA) | 148 | $22,290,000 | $150,608 | $3,031 | 7.71% |
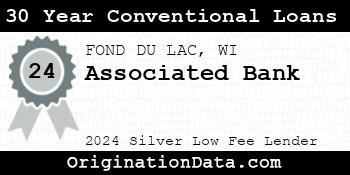
| FOND DU LAC, WI (FHA|USDA|VA) | 114 | $19,620,000 | $172,105 | $2,432 | 7.43% |
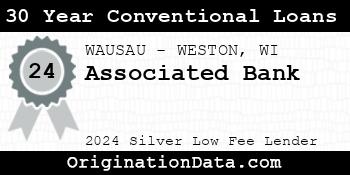
| WAUSAU-WESTON, WI (FHA|USDA|VA) | 142 | $19,530,000 | $137,535 | $2,684 | 7.77% |
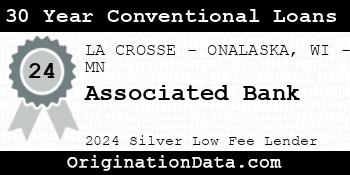
| LA CROSSE-ONALASKA, WI-MN (FHA|USDA|VA) | 78 | $15,710,000 | $201,410 | $2,694 | 7.37% |
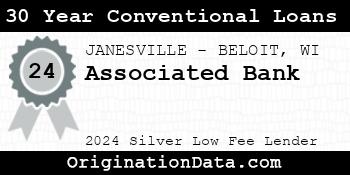
| JANESVILLE-BELOIT, WI (FHA|USDA|VA) | 138 | $15,630,000 | $113,261 | $2,720 | 7.78% |
| ROCHESTER, MN (FHA|USDA|VA) | 48 | $15,610,000 | $325,208 | $4,518 | 7.60% |
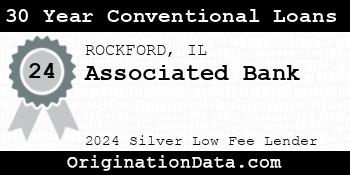
| ROCKFORD, IL (FHA|USDA|VA) | 137 | $13,265,000 | $96,825 | $3,309 | 8.16% |
| SHEBOYGAN, WI (FHA|USDA|VA) | 84 | $12,890,000 | $153,452 | $2,530 | 7.61% |
| Manitowoc, WI (FHA|USDA|VA) | 92 | $12,010,000 | $130,543 | $2,535 | 7.49% |
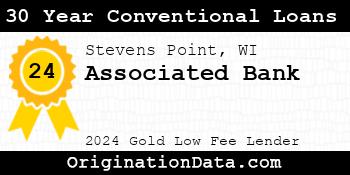
| Stevens Point, WI (FHA|USDA|VA) | 68 | $10,370,000 | $152,500 | $2,573 | 7.64% |
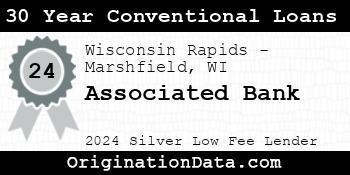
| Wisconsin Rapids-Marshfield, WI (FHA|USDA|VA) | 82 | $10,150,000 | $123,780 | $2,487 | 7.64% |
| Beaver Dam, WI (FHA|USDA|VA) | 62 | $8,090,000 | $130,484 | $2,644 | 7.94% |
| Marinette, WI-MI (FHA|USDA|VA) | 74 | $7,860,000 | $106,216 | $2,534 | 7.79% |
| PHOENIX-MESA-CHANDLER, AZ (FHA|USDA|VA) | 8 | $7,690,000 | $961,250 | $6,172 | 6.44% |
| Shawano, WI (FHA|USDA|VA) | 62 | $7,300,000 | $117,742 | $2,564 | 8.05% |
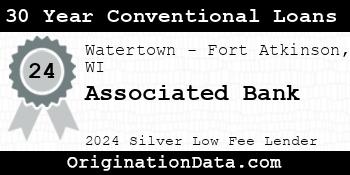
| Watertown-Fort Atkinson, WI (FHA|USDA|VA) | 58 | $6,870,000 | $118,448 | $2,616 | 8.28% |
| NILES, MI (FHA|USDA|VA) | 6 | $5,840,000 | $973,333 | $5,278 | 6.83% |
| Miami-Fort Lauderdale-Pompano Beach, FL (FHA|USDA|VA) | 3 | $3,965,000 | $1,321,667 | $5,706 | 6.71% |
| Brainerd, MN (FHA|USDA|VA) | 8 | $3,770,000 | $471,250 | $4,706 | 7.16% |
| DULUTH, MN-WI (FHA|USDA|VA) | 11 | $3,225,000 | $293,182 | $3,267 | 6.94% |
| Red Wing, MN (FHA|USDA|VA) | 17 | $2,875,000 | $169,118 | $3,989 | 7.92% |
| NAPLES-MARCO ISLAND, FL (FHA|USDA|VA) | 1 | $2,005,000 | $2,005,000 | $11,736 | 5.88% |
| Fergus Falls, MN (FHA|USDA|VA) | 1 | $1,685,000 | $1,685,000 | $8,398 | 6.50% |
| Baraboo, WI (FHA|USDA|VA) | 16 | $1,650,000 | $103,125 | $3,061 | 8.13% |
| Menomonie, WI (FHA|USDA|VA) | 9 | $1,435,000 | $159,444 | $2,403 | 7.61% |
| CRESTVIEW-FORT WALTON BEACH-DESTIN, FL (FHA|USDA|VA) | 2 | $1,310,000 | $655,000 | $5,163 | 6.44% |
| Iron Mountain, MI-WI (FHA|USDA|VA) | 6 | $1,200,000 | $200,000 | $2,794 | 7.44% |
| TAMPA-ST. PETERSBURG-CLEARWATER, FL (FHA|USDA|VA) | 3 | $1,145,000 | $381,667 | $3,700 | 7.08% |
| PEORIA, IL (FHA|USDA|VA) | 11 | $935,000 | $85,000 | $2,300 | 7.98% |
| ORLANDO-KISSIMMEE-SANFORD, FL (FHA|USDA|VA) | 3 | $835,000 | $278,333 | $3,022 | 7.17% |
| DAVENPORT-MOLINE-ROCK ISLAND, IA-IL (FHA|USDA|VA) | 3 | $825,000 | $275,000 | $2,609 | 6.29% |
| PORT ST. LUCIE, FL (FHA|USDA|VA) | 1 | $695,000 | $695,000 | $8,773 | 6.38% |
| CAPE CORAL-FORT MYERS, FL (FHA|USDA|VA) | 2 | $570,000 | $285,000 | $2,917 | 6.00% |
| Faribault-Northfield, MN (FHA|USDA|VA) | 3 | $565,000 | $188,333 | $7,494 | 7.50% |
| Willmar, MN (FHA|USDA|VA) | 2 | $560,000 | $280,000 | $3,147 | 6.88% |
| LAKELAND-WINTER HAVEN, FL (FHA|USDA|VA) | 1 | $535,000 | $535,000 | $2,341 | 6.38% |
| MICHIGAN CITY-LA PORTE, IN (FHA|USDA|VA) | 1 | $505,000 | $505,000 | $0 | 8.13% |
| Warsaw, IN (FHA|USDA|VA) | 2 | $480,000 | $240,000 | $3,665 | 6.44% |
| Rochelle, IL (FHA|USDA|VA) | 5 | $475,000 | $95,000 | $2,582 | 8.10% |
| GRAND RAPIDS-KENTWOOD, MI (FHA|USDA|VA) | 1 | $475,000 | $475,000 | $13,764 | 6.38% |
| Escanaba, MI (FHA|USDA|VA) | 1 | $455,000 | $455,000 | $4,515 | 6.00% |
| JACKSONVILLE, FL (FHA|USDA|VA) | 1 | $405,000 | $405,000 | $4,159 | 6.00% |
| Winona, MN (FHA|USDA|VA) | 2 | $340,000 | $170,000 | $3,207 | 6.38% |
| TUCSON, AZ (FHA|USDA|VA) | 3 | $325,000 | $108,333 | $3,597 | 7.58% |
| DELTONA-DAYTONA BEACH-ORMOND BEACH, FL (FHA|USDA|VA) | 1 | $305,000 | $305,000 | $2,794 | 6.13% |
| Platteville, WI (FHA|USDA|VA) | 2 | $300,000 | $150,000 | $2,530 | 7.63% |
| CLEVELAND-ELYRIA, OH (FHA|USDA|VA) | 1 | $295,000 | $295,000 | $3,736 | 6.63% |
| SOUTH BEND-MISHAWAKA, IN-MI (FHA|USDA|VA) | 1 | $255,000 | $255,000 | $0 | 8.25% |
| Freeport, IL (FHA|USDA|VA) | 2 | $240,000 | $120,000 | $3,055 | 6.75% |
| COLUMBIA, MO (FHA|USDA|VA) | 1 | $235,000 | $235,000 | $0 | 7.00% |
| ST. CLOUD, MN (FHA|USDA|VA) | 1 | $215,000 | $215,000 | $0 | 7.13% |
| PANAMA CITY, FL (FHA|USDA|VA) | 1 | $205,000 | $205,000 | $0 | 7.50% |
| CHAMPAIGN-URBANA, IL (FHA|USDA|VA) | 1 | $205,000 | $205,000 | $0 | 8.50% |
| Hutchinson, MN (FHA|USDA|VA) | 1 | $185,000 | $185,000 | $2,652 | 6.38% |
| CARBONDALE-MARION, IL (FHA|USDA|VA) | 1 | $175,000 | $175,000 | $2,516 | 6.50% |
| CAPE GIRARDEAU, MO-IL (FHA|USDA|VA) | 2 | $170,000 | $85,000 | $3,157 | 6.63% |
| Marquette, MI (FHA|USDA|VA) | 1 | $165,000 | $165,000 | $2,184 | 6.75% |
| Dixon, IL (FHA|USDA|VA) | 1 | $165,000 | $165,000 | $3,053 | 6.75% |
| Grand Rapids, MN (FHA|USDA|VA) | 1 | $155,000 | $155,000 | $3,337 | 6.00% |
| AMES, IA (FHA|USDA|VA) | 1 | $155,000 | $155,000 | $3,290 | 6.25% |
| Detroit-Warren-Dearborn, MI (FHA|USDA|VA) | 1 | $155,000 | $155,000 | $0 | 8.63% |
| KALAMAZOO-PORTAGE, MI (FHA|USDA|VA) | 1 | $135,000 | $135,000 | $2,245 | 5.88% |
| KANKAKEE, IL (FHA|USDA|VA) | 1 | $135,000 | $135,000 | $3,934 | 7.13% |
| Ottawa, IL (FHA|USDA|VA) | 2 | $100,000 | $50,000 | $2,513 | 7.44% |
| BLOOMINGTON, IL (FHA|USDA|VA) | 1 | $75,000 | $75,000 | $0 | 7.75% |
| Angola, IN (FHA|USDA|VA) | 1 | $45,000 | $45,000 | $0 | 9.50% |
| Jacksonville, IL (FHA|USDA|VA) | 1 | $35,000 | $35,000 | $0 | 7.00% |
| Mason City, IA (FHA|USDA|VA) | 1 | $35,000 | $35,000 | $0 | 8.38% |
| Centralia, IL (FHA|USDA|VA) | 1 | $35,000 | $35,000 | $0 | 7.00% |
| Taylorville, IL (FHA|USDA|VA) | 1 | $35,000 | $35,000 | $2,503 | 6.13% |
| Pontiac, IL (FHA|USDA|VA) | 1 | $25,000 | $25,000 | $0 | 7.88% |
Similar Lenders
We use machine learning to identify the top lenders compared against Associated Bank based on their rates and fees, along with other useful metrics. A lower similarity rank signals a stronger match.
Similarity Rank: 22
Similarity Rank: 45
Similarity Rank: 49
Similarity Rank: 70
Similarity Rank: 84
Similarity Rank: 91
Similarity Rank: 126
Similarity Rank: 130
Similarity Rank: 144
Similarity Rank: 162
Product Mix
For 2024, Associated Bank's most frequently originated type of loan was HELOC, with 3,369 originations. Their 2nd most popular type was Conventional, with 2,974 originations.
Loan Reason
For 2024, Associated Bank's most frequently cited loan purpose was Home Purchase, with 2,918 originations. The 2nd most popular reason was Home Improvement, with 1,275 originations.
Loan Duration/Length
For 2024, Associated Bank's most frequently cited loan duration was 30 Year, with 6,312 originations. The 2nd most popular length was 15 Year, with 106 originations.
Origination Fees/Closing Costs
Associated Bank's average total fees were $3,422, while their most frequently occuring range of origination fees (closing costs) were in the $<1k bucket, with 2,499 originations.
Interest Rates
During 2024, Associated Bank's average interest rate for loans was 7.64%, while their most frequently originated rate bucket for loans was Over 8%, with 2,678 originations.
Loan Sizing
2024 saw Associated Bank place emphasis on $100,000 or less loans with 2,545 originations, totaling $130,285,000 in origination value.
Applicant Income
Associated Bank lent most frequently to those with incomes in the $50k-75k range, with 1,407 originations. The second most popular income band? $100k-150k, with 1,297 originations.
Applicant Debt to Income Ratio
Associated Bank lent most frequently to those with DTI ratios of 20-30%, with 1,414 originations. The next most common DTI ratio? 30-36%, with 1,139 originations.
Ethnicity Mix
Approval Rates
Total approvals of all applications75.64%
Associated Bank has a below average approval rate.
Pick Rate
Approvals leading to origination87.46%
Associated Bank has an average pick rate.
Points and Fees
| Points | Originations | Total Value | Average Loan |
|---|---|---|---|
| NA | 6,532 | $2,022,920,000 | $309,694 |
Occupancy Type Mix
| Dwelling Type | Originations | Total Value | Average Loan |
|---|---|---|---|
| 6,532 | $2,022,920,000 | $309,694 |