First Financial Bank Mortgage Rates, Fees & Info
Cincinnati, OHLEI: MV4O55SH8HO6KQSGW013
Tax ID: 31-0308605
Latest/2024 | 2023 Data | 2022 Data | 2021 Data | 2020 Data | 2019 Data | 2018 Data
Jump to:
Mortgage Data
Bank Data
Review & Overview
First Financial Bank is a small bank specializing in Refi and Home Purchase loans. First Financial Bank has a high proportion of conventional loans. They have a a low proportion of FHA loans. (This may mean they shy away from first time homebuyers.) They have a low ratio of USDA loans. Their top markets by origination volume include: Cincinnati, Columbus, Louisville, Indianapolis, and Chicago among others. We have data for 133 markets. (Some data included below & more in-depth data is available with an active subscription.)First Financial Bank has an average approval rate when compared to the average across all lenders. They have a below average pick rate when compared to similar lenders. First Financial Bank is typically a low fee lender. (We use the term "fees" to include things like closing costs and other costs incurred by borrowers-- whether they are paid out of pocket or rolled into the loan.) They typically have about average rates.
We show data for every lender and do not change our ratings-- even if an organization is a paid advertiser. Our consensus data does have lag, but it is highly correlated to a lender's rates & fees relative to their markets. This means that if a bank is a low fee/rate lender the past-- chances are they are still one today. Our SimulatedRates™ use advanced statistical techniques to forecast different rates based on a lender's historical data.
Mortgage seekers: Choose your metro area here to explore the lowest fee & rate lenders.
Mortgage professionals: We have various tools to make your lives easier. Contact us to see how we can help with your market research, analytics or advertising needs.
SimulatedRates™Mortgage Type |
Simulated Rate | Simulation Date |
|---|---|---|
| Home Equity Line of Credit (HELOC) | 8.00% | 7/6/26 |
| 30 Year Conventional Purchase | 5.16% | 7/6/26 |
| 30 Year Conventional Refi | 7.13% | 7/6/26 |
| 30 Year Cash-out Refi | 7.39% | 7/6/26 |
| 30 Year FHA Purchase | 7.34% | 7/6/26 |
| 30 Year FHA Refi | 7.27% | 7/6/26 |
| 30 Year VA Purchase | 6.90% | 7/6/26 |
| 30 Year VA Refi | 6.72% | 7/6/26 |
| 30 Year USDA Purchase | 7.00% | 7/6/26 |
| 15 Year Conventional Purchase | 6.33% | 7/6/26 |
| 15 Year Conventional Refi | 6.01% | 7/6/26 |
| 15 Year Cash-out Refi | 6.01% | 7/6/26 |
| These are simulated rates generated by our proprietary machine learning models. These are not guaranteed by the bank. They are our estimates based on a lender's past behaviors combined with current market conditions. Contact an individual lender for their actual rates. Our models use fixed rate terms for conforming loans, 700+ FICO, 10% down for FHA and 20% for conventional. These are based on consensus, historical data-- not advertised promotional rates. | ||
First Financial Bank Mortgage Calculator
Your Estimates
Estimated Loan Payment: Update the calculator values and click calculate payment!
This is not an official calculator from First Financial Bank. It uses our SimulatedRate™
technology, basic math and reasonable assumptions to calculate mortgage payments derived from our simulations and your inputs.
The default purchase price is the median sales price across the US for 2022Q4, per FRED.
Originations
10,411Origination Dollar Volume (All Markets)
$1,787,585,000Employee count
2,075Awards


First Financial Bank - 2020
First Financial Bank is a 2020 , due to their low .
For 2020, less than of lenders were eligible for this award.
Work for First Financial Bank?
Use this award on your own site. Either save and use the images below, or pass the provided image embed code to your development team.
Top Markets
Zoom/scroll map to see bank's per metro statistics. Subscribers can configure state/metro/county granularity, assorted fields and quantity of results. This map shows top 10 markets in the map viewport, as defined by descending origination volume.
| Market | Originations | Total Value | Average Loan | Average Fees | Average Rate |
|---|---|---|---|---|---|
| CINCINNATI, OH-KY-IN (FHA|USDA|VA) | 2,724 | $414,110,000 | $152,023 | $2,564 | 3.52% |
| COLUMBUS, OH (FHA|USDA|VA) | 1,277 | $353,765,000 | $277,028 | $3,364 | 3.29% |
| LOUISVILLE, KY (FHA|USDA|VA) | 1,288 | $252,460,000 | $196,009 | $2,419 | 3.07% |
| INDIANAPOLIS-CARMEL-ANDERSON, IN (FHA|USDA|VA) | 1,144 | $189,350,000 | $165,516 | $2,229 | 3.38% |
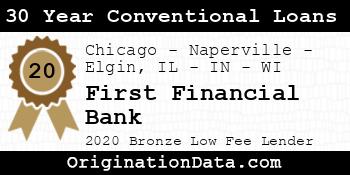
| Chicago-Naperville-Elgin, IL-IN-WI (FHA|USDA|VA) | 623 | $99,285,000 | $159,366 | $2,457 | 3.36% |
| Outside of Metro Areas | 679 | $74,535,000 | $109,772 | $2,047 | 3.56% |
| COLUMBUS, IN (FHA|USDA|VA) | 377 | $63,505,000 | $168,448 | $2,328 | 3.24% |
| DAYTON-KETTERING, OH (FHA|USDA|VA) | 330 | $48,140,000 | $145,879 | $2,608 | 3.53% |
| Madison, IN (FHA|USDA|VA) | 235 | $26,825,000 | $114,149 | $2,324 | 3.42% |
| Richmond, IN (FHA|USDA|VA) | 284 | $25,360,000 | $89,296 | $1,812 | 3.17% |
| CLEVELAND-ELYRIA, OH (FHA|USDA|VA) | 26 | $22,960,000 | $883,077 | $3,851 | 3.43% |
| BLOOMINGTON, IN (FHA|USDA|VA) | 76 | $18,980,000 | $249,737 | $2,458 | 3.27% |
| TOLEDO, OH (FHA|USDA|VA) | 12 | $18,660,000 | $1,555,000 | $3,020 | 2.92% |
| Greensburg, IN (FHA|USDA|VA) | 139 | $16,895,000 | $121,547 | $2,031 | 3.36% |
| Seymour, IN (FHA|USDA|VA) | 111 | $14,975,000 | $134,910 | $2,481 | 3.56% |
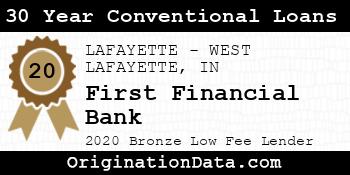
| LAFAYETTE-WEST LAFAYETTE, IN (FHA|USDA|VA) | 93 | $10,525,000 | $113,172 | $1,331 | 3.78% |
| Celina, OH (FHA|USDA|VA) | 84 | $10,300,000 | $122,619 | $3,035 | 3.28% |
| Frankfort, KY (FHA|USDA|VA) | 73 | $9,195,000 | $125,959 | $2,774 | 3.62% |
| North Vernon, IN (FHA|USDA|VA) | 90 | $8,520,000 | $94,667 | $1,761 | 3.61% |
| Connersville, IN (FHA|USDA|VA) | 84 | $6,900,000 | $82,143 | $2,167 | 3.50% |
| Van Wert, OH (FHA|USDA|VA) | 60 | $5,720,000 | $95,333 | $2,318 | 3.50% |
| Crawfordsville, IN (FHA|USDA|VA) | 46 | $4,950,000 | $107,609 | $1,494 | 3.81% |
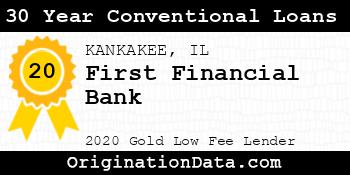
| KANKAKEE, IL (FHA|USDA|VA) | 48 | $4,810,000 | $100,208 | $1,885 | 3.37% |
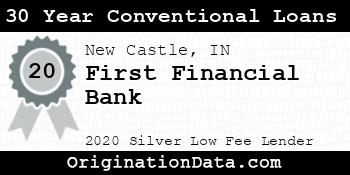
| New Castle, IN (FHA|USDA|VA) | 53 | $4,085,000 | $77,075 | $1,661 | 3.74% |
| North Port-Sarasota-Bradenton, FL (FHA|USDA|VA) | 7 | $3,945,000 | $563,571 | $5,285 | 3.41% |
| LEXINGTON-FAYETTE, KY (FHA|USDA|VA) | 20 | $2,950,000 | $147,500 | $2,550 | 3.09% |
| KNOXVILLE, TN (FHA|USDA|VA) | 7 | $2,835,000 | $405,000 | $4,216 | 3.20% |
| JACKSONVILLE, FL (FHA|USDA|VA) | 4 | $2,690,000 | $672,500 | $5,121 | 3.31% |
| Wapakoneta, OH (FHA|USDA|VA) | 22 | $2,560,000 | $116,364 | $2,708 | 3.37% |
| AKRON, OH (FHA|USDA|VA) | 12 | $2,250,000 | $187,500 | $2,921 | 3.60% |
| CRESTVIEW-FORT WALTON BEACH-DESTIN, FL (FHA|USDA|VA) | 3 | $2,245,000 | $748,333 | $7,598 | 3.21% |
| MUNCIE, IN (FHA|USDA|VA) | 19 | $2,195,000 | $115,526 | $2,246 | 3.25% |
| TAMPA-ST. PETERSBURG-CLEARWATER, FL (FHA|USDA|VA) | 6 | $2,180,000 | $363,333 | $5,430 | 3.27% |
| TERRE HAUTE, IN (FHA|USDA|VA) | 17 | $2,035,000 | $119,706 | $1,885 | 3.51% |
| Key West, FL (FHA|USDA|VA) | 3 | $1,985,000 | $661,667 | $7,085 | 3.54% |
| NAPLES-MARCO ISLAND, FL (FHA|USDA|VA) | 5 | $1,915,000 | $383,000 | $5,241 | 3.10% |
| Fremont, OH (FHA|USDA|VA) | 25 | $1,775,000 | $71,000 | $1,987 | 3.88% |
| LIMA, OH (FHA|USDA|VA) | 15 | $1,715,000 | $114,333 | $2,569 | 3.51% |
| Scottsburg, IN (FHA|USDA|VA) | 11 | $1,685,000 | $153,182 | $2,858 | 3.51% |
| Jackson, OH (FHA|USDA|VA) | 3 | $1,635,000 | $545,000 | $4,716 | 2.95% |
| Bellefontaine, OH (FHA|USDA|VA) | 7 | $1,635,000 | $233,571 | $2,411 | 3.40% |
| CAPE CORAL-FORT MYERS, FL (FHA|USDA|VA) | 8 | $1,630,000 | $203,750 | $3,989 | 2.66% |
| ORLANDO-KISSIMMEE-SANFORD, FL (FHA|USDA|VA) | 4 | $1,570,000 | $392,500 | $4,636 | 3.38% |
| Sandusky, OH (FHA|USDA|VA) | 5 | $1,545,000 | $309,000 | $2,539 | 3.55% |
| Wilmington, OH (FHA|USDA|VA) | 14 | $1,460,000 | $104,286 | $2,619 | 3.59% |
| FORT WAYNE, IN (FHA|USDA|VA) | 10 | $1,450,000 | $145,000 | $2,135 | 3.64% |
| ATLANTA-SANDY SPRINGS-ALPHARETTA, GA (FHA|USDA|VA) | 4 | $1,420,000 | $355,000 | $3,215 | 3.22% |
| PALM BAY-MELBOURNE-TITUSVILLE, FL (FHA|USDA|VA) | 5 | $1,405,000 | $281,000 | $3,464 | 3.09% |
| Greenville, OH (FHA|USDA|VA) | 15 | $1,375,000 | $91,667 | $1,398 | 3.56% |
| SPRINGFIELD, OH (FHA|USDA|VA) | 8 | $1,110,000 | $138,750 | $1,971 | 3.79% |
| CHARLOTTE-CONCORD-GASTONIA, NC-SC (FHA|USDA|VA) | 3 | $1,055,000 | $351,667 | $3,357 | 3.21% |
| Sidney, OH (FHA|USDA|VA) | 5 | $1,025,000 | $205,000 | $3,009 | 3.33% |
| Danville, KY (FHA|USDA|VA) | 9 | $1,015,000 | $112,778 | $2,325 | 3.76% |
| DENVER-AURORA-LAKEWOOD, CO (FHA|USDA|VA) | 2 | $1,000,000 | $500,000 | $2,532 | 2.69% |
| HILTON HEAD ISLAND-BLUFFTON, SC (FHA|USDA|VA) | 3 | $995,000 | $331,667 | $3,869 | 3.42% |
| Miami-Fort Lauderdale-Pompano Beach, FL (FHA|USDA|VA) | 3 | $975,000 | $325,000 | $4,464 | 3.13% |
| Bardstown, KY (FHA|USDA|VA) | 6 | $950,000 | $158,333 | $2,061 | 3.46% |
| Decatur, IN (FHA|USDA|VA) | 6 | $890,000 | $148,333 | $2,698 | 3.75% |
| Detroit-Warren-Dearborn, MI (FHA|USDA|VA) | 3 | $875,000 | $291,667 | $2,972 | 3.21% |
| Mount Vernon, OH (FHA|USDA|VA) | 3 | $865,000 | $288,333 | $2,999 | 2.93% |
| Marion, IN (FHA|USDA|VA) | 5 | $805,000 | $161,000 | $2,982 | 3.05% |
| DANVILLE, IL (FHA|USDA|VA) | 15 | $805,000 | $53,667 | $1,347 | 3.47% |
| Frankfort, IN (FHA|USDA|VA) | 9 | $745,000 | $82,778 | $802 | 3.80% |
| TALLAHASSEE, FL (FHA|USDA|VA) | 3 | $705,000 | $235,000 | $6,866 | 3.62% |
| Georgetown, SC (FHA|USDA|VA) | 1 | $675,000 | $675,000 | $5,174 | 3.88% |
| EVANSVILLE, IN-KY (FHA|USDA|VA) | 4 | $600,000 | $150,000 | $3,340 | 3.22% |
| Ashland, OH (FHA|USDA|VA) | 4 | $560,000 | $140,000 | $3,137 | 3.22% |
| Bedford, IN (FHA|USDA|VA) | 3 | $545,000 | $181,667 | $2,861 | 2.87% |
| Washington-Arlington-Alexandria, DC-VA-MD-WV (FHA|USDA|VA) | 1 | $545,000 | $545,000 | $3,068 | 3.88% |
| Marion, OH (FHA|USDA|VA) | 4 | $540,000 | $135,000 | $2,886 | 3.56% |
| CHARLESTON-NORTH CHARLESTON, SC (FHA|USDA|VA) | 2 | $520,000 | $260,000 | $2,764 | 3.25% |
| Zanesville, OH (FHA|USDA|VA) | 1 | $505,000 | $505,000 | $5,631 | 2.88% |
| Angola, IN (FHA|USDA|VA) | 3 | $505,000 | $168,333 | $1,392 | 3.00% |
| Norwalk, OH (FHA|USDA|VA) | 5 | $505,000 | $101,000 | $1,902 | 3.58% |
| LANSING-EAST LANSING, MI (FHA|USDA|VA) | 2 | $470,000 | $235,000 | $924 | 3.06% |
| Traverse City, MI (FHA|USDA|VA) | 1 | $465,000 | $465,000 | $2,674 | 2.75% |
| Warsaw, IN (FHA|USDA|VA) | 4 | $460,000 | $115,000 | $2,229 | 3.48% |
| VIRGINIA BEACH-NORFOLK-NEWPORT NEWS, VA-NC (FHA|USDA|VA) | 1 | $455,000 | $455,000 | $2,818 | 2.75% |
| GREENVILLE-ANDERSON, SC (FHA|USDA|VA) | 3 | $445,000 | $148,333 | $2,318 | 3.33% |
| ELIZABETHTOWN-FORT KNOX, KY (FHA|USDA|VA) | 2 | $410,000 | $205,000 | $0 | 3.49% |
| Marion, NC (FHA|USDA|VA) | 1 | $405,000 | $405,000 | $4,562 | 3.50% |
| SAVANNAH, GA (FHA|USDA|VA) | 1 | $405,000 | $405,000 | $3,726 | 3.00% |
| Glasgow, KY (FHA|USDA|VA) | 1 | $405,000 | $405,000 | $3,519 | 2.88% |
| NASHVILLE-DAVIDSON-MURFREESBORO-FRANKLIN, TN (FHA|USDA|VA) | 2 | $400,000 | $200,000 | $2,837 | 3.69% |
| GRAND RAPIDS-KENTWOOD, MI (FHA|USDA|VA) | 1 | $375,000 | $375,000 | $8,292 | 3.38% |
| KOKOMO, IN (FHA|USDA|VA) | 3 | $375,000 | $125,000 | $3,319 | 3.00% |
| Richmond-Berea, KY (FHA|USDA|VA) | 2 | $370,000 | $185,000 | $2,496 | 2.69% |
| YOUNGSTOWN-WARREN-BOARDMAN, OH-PA (FHA|USDA|VA) | 3 | $365,000 | $121,667 | $2,901 | 3.26% |
| CHATTANOOGA, TN-GA (FHA|USDA|VA) | 2 | $340,000 | $170,000 | $2,934 | 3.13% |
| SOUTH BEND-MISHAWAKA, IN-MI (FHA|USDA|VA) | 3 | $335,000 | $111,667 | $2,473 | 3.68% |
| Athens, OH (FHA|USDA|VA) | 2 | $330,000 | $165,000 | $3,394 | 3.06% |
| NILES, MI (FHA|USDA|VA) | 2 | $320,000 | $160,000 | $2,296 | 4.00% |
| Urbana, OH (FHA|USDA|VA) | 2 | $300,000 | $150,000 | $3,668 | 3.31% |
| Sebastian-Vero Beach, FL (FHA|USDA|VA) | 1 | $295,000 | $295,000 | $4,243 | 3.13% |
| Washington Court House, OH (FHA|USDA|VA) | 2 | $290,000 | $145,000 | $3,246 | 4.00% |
| Vincennes, IN (FHA|USDA|VA) | 3 | $285,000 | $95,000 | $1,085 | 3.87% |
| MICHIGAN CITY-LA PORTE, IN (FHA|USDA|VA) | 3 | $275,000 | $91,667 | $493 | 4.03% |
| Brevard, NC (FHA|USDA|VA) | 1 | $275,000 | $275,000 | $2,207 | 3.63% |
| ANN ARBOR, MI (FHA|USDA|VA) | 1 | $265,000 | $265,000 | $2,600 | 3.00% |
| PANAMA CITY, FL (FHA|USDA|VA) | 1 | $245,000 | $245,000 | $3,847 | 3.63% |
| CANTON-MASSILLON, OH (FHA|USDA|VA) | 2 | $240,000 | $120,000 | $2,194 | 3.75% |
| Sevierville, TN (FHA|USDA|VA) | 1 | $235,000 | $235,000 | $4,092 | 3.38% |
| Cambridge, OH (FHA|USDA|VA) | 3 | $225,000 | $75,000 | $1,683 | 2.55% |
| Crossville, TN (FHA|USDA|VA) | 1 | $215,000 | $215,000 | $3,408 | 2.88% |
| Logansport, IN (FHA|USDA|VA) | 3 | $205,000 | $68,333 | $2,069 | 3.51% |
| Marietta, OH (FHA|USDA|VA) | 2 | $200,000 | $100,000 | $3,311 | 3.31% |
| PENSACOLA-FERRY PASS-BRENT, FL (FHA|USDA|VA) | 1 | $195,000 | $195,000 | $2,867 | 2.75% |
| COLORADO SPRINGS, CO (FHA|USDA|VA) | 1 | $195,000 | $195,000 | $3,476 | 3.25% |
| Freeport, IL (FHA|USDA|VA) | 1 | $195,000 | $195,000 | $0 | 3.10% |
| Kendallville, IN (FHA|USDA|VA) | 2 | $180,000 | $90,000 | $2,838 | 2.75% |
| BOWLING GREEN, KY (FHA|USDA|VA) | 2 | $160,000 | $80,000 | $1,032 | 2.01% |
| PORT ST. LUCIE, FL (FHA|USDA|VA) | 1 | $135,000 | $135,000 | $3,314 | 2.88% |
| Mount Sterling, KY (FHA|USDA|VA) | 1 | $135,000 | $135,000 | $5,595 | 4.25% |
| Cadillac, MI (FHA|USDA|VA) | 1 | $125,000 | $125,000 | $1,878 | 2.75% |
| Somerset, KY (FHA|USDA|VA) | 1 | $125,000 | $125,000 | $3,324 | 3.63% |
| CHAMPAIGN-URBANA, IL (FHA|USDA|VA) | 1 | $115,000 | $115,000 | $2,336 | 4.50% |
| MYRTLE BEACH-CONWAY-NORTH MYRTLE BEACH, SC-NC (FHA|USDA|VA) | 2 | $110,000 | $55,000 | $0 | 3.49% |
| CLARKSVILLE, TN-KY (FHA|USDA|VA) | 1 | $95,000 | $95,000 | $2,708 | 3.25% |
| THE VILLAGES, FL (FHA|USDA|VA) | 1 | $85,000 | $85,000 | $2,094 | 2.75% |
| Ottawa, IL (FHA|USDA|VA) | 1 | $85,000 | $85,000 | $0 | 3.90% |
| Auburn, IN (FHA|USDA|VA) | 1 | $85,000 | $85,000 | $2,105 | 4.38% |
| Effingham, IL (FHA|USDA|VA) | 1 | $85,000 | $85,000 | $1,460 | 4.00% |
| Charleston-Mattoon, IL (FHA|USDA|VA) | 1 | $85,000 | $85,000 | $1,819 | 3.38% |
| Wabash, IN (FHA|USDA|VA) | 2 | $80,000 | $40,000 | $1,458 | 5.03% |
| Centralia, IL (FHA|USDA|VA) | 1 | $65,000 | $65,000 | $2,334 | 3.25% |
| MANSFIELD, OH (FHA|USDA|VA) | 1 | $65,000 | $65,000 | $2,532 | 4.75% |
| New Philadelphia-Dover, OH (FHA|USDA|VA) | 1 | $65,000 | $65,000 | $2,631 | 3.00% |
| New Castle, PA (FHA|USDA|VA) | 1 | $55,000 | $55,000 | $4,107 | 3.63% |
| Washington, IN (FHA|USDA|VA) | 1 | $55,000 | $55,000 | $0 | 3.90% |
| Holland, MI (FHA|USDA|VA) | 1 | $55,000 | $55,000 | $0 | 3.15% |
| Defiance, OH (FHA|USDA|VA) | 1 | $45,000 | $45,000 | $0 | 3.74% |
| HUNTINGTON-ASHLAND, WV-KY-OH (FHA|USDA|VA) | 1 | $15,000 | $15,000 | $0 | 6.25% |
| Campbellsville, KY (FHA|USDA|VA) | 1 | $5,000 | $5,000 | $0 | 5.25% |
Similar Lenders
We use machine learning to identify the top lenders compared against First Financial Bank based on their rates and fees, along with other useful metrics. A lower similarity rank signals a stronger match.
Similarity Rank: 153
Similarity Rank: 203
Similarity Rank: 203
Similarity Rank: 264
Similarity Rank: 312
Similarity Rank: 312
Similarity Rank: 350
Similarity Rank: 376
Similarity Rank: 396
Similarity Rank: 405
Product Mix
For 2020, First Financial Bank's most frequently originated type of loan was Conventional, with 6,584 originations. Their 2nd most popular type was HELOC, with 3,485 originations.
Loan Reason
For 2020, First Financial Bank's most frequently cited loan purpose was Refi, with 3,950 originations. The 2nd most popular reason was Home Purchase, with 3,053 originations.
Loan Duration/Length
For 2020, First Financial Bank's most frequently cited loan duration was 30 Year, with 4,545 originations. The 2nd most popular length was Other, with 3,605 originations.
Origination Fees/Closing Costs
First Financial Bank's average total fees were $2,916, while their most frequently occuring range of origination fees (closing costs) were in the $<1k bucket, with 5,045 originations.
Interest Rates
During 2020, First Financial Bank's average interest rate for loans was 3.22%, while their most frequently originated rate bucket for loans was 3-4%, with 5,247 originations.
Loan Sizing
2020 saw First Financial Bank place emphasis on $100,000 or less loans with 3,970 originations, totaling $209,320,000 in origination value.
Applicant Income
First Financial Bank lent most frequently to those with incomes in the $50k or less range, with 2,171 originations. The second most popular income band? $50k-75k, with 2,163 originations.
Applicant Debt to Income Ratio
First Financial Bank lent most frequently to those with DTI ratios of 20-30%, with 2,953 originations. The next most common DTI ratio? 30-36%, with 2,004 originations.
Ethnicity Mix
Approval Rates
Total approvals of all applications79.12%
First Financial Bank has a below average approval rate.
Pick Rate
Approvals leading to origination87.12%
First Financial Bank has an average pick rate.
Points and Fees
| Points | Originations | Total Value | Average Loan |
|---|---|---|---|
| NA | 10,411 | $1,787,585,000 | $171,702 |
Occupancy Type Mix
LTV Distribution
Complaints
| Bank Name | Product | Issue | 2020 CPFB Complaints | % of Total Issues |
|---|---|---|---|---|
| FIRST FINANCIAL BANCORP | Conventional home mortgage | Applying for a mortgage or refinancing an existing mortgage | 1 | 14.3% |
| FIRST FINANCIAL BANCORP | Other type of mortgage | Closing on a mortgage | 1 | 14.3% |
| FIRST FINANCIAL BANCORP | Home equity loan or line of credit (HELOC) | Trouble during payment process | 1 | 14.3% |
| FIRST FINANCIAL BANCORP | Home equity loan or line of credit (HELOC) | Applying for a mortgage or refinancing an existing mortgage | 2 | 28.6% |
| FIRST FINANCIAL BANCORP | Conventional home mortgage | Trouble during payment process | 1 | 14.3% |
| FIRST FINANCIAL BANCORP | Conventional home mortgage | Struggling to pay mortgage | 1 | 14.3% |
Bank Details
Branches
| Bank Name | Branch | Branch Type | Deposits (000's) |
|---|---|---|---|
| First Financial Bank | 202 North Main Street Rushville, IN 46173 | Full Service B&M | $120,104 |
| First Financial Bank | 1 East 4th Street Cincinnati, OH 45202 | Full Service B&M | $251,460 |
| First Financial Bank | 100 East Spring Street New Albany, IN 47150 | Full Service B&M | $80,329 |
| First Financial Bank | 101 East Elm Street Union City, OH 45390 | Full Service B&M | $54,677 |
| First Financial Bank | 101 West Washington Street Hartford City, IN 47348 | Full Service B&M | $45,611 |
| First Financial Bank | 10100 Montgomery Rd Cincinnati, OH 45242 | Full Service B&M | $93,253 |
| First Financial Bank | 1012 Bypass North Lawrenceburg, KY 40342 | Full Service B&M | $35,786 |
| First Financial Bank | 1012 South Adams Street Versailles, IN 47042 | Full Service B&M | $24,815 |
| First Financial Bank | 1015 South Main Street Centerville, OH 45458 | Full Service B&M | $95,885 |
| First Financial Bank | 102 W Main Street Vevay, IN 47043 | Full Service B&M | $48,831 |
| First Financial Bank | 102 West Main Street Hagerstown, IN 47346 | Full Service B&M | $35,419 |
| First Financial Bank | 104 E Link's Way Aurora, IN 47001 | Full Service B&M | $61,466 |
| First Financial Bank | 104 S Chiles St Harrodsburg, KY 40330 | Full Service B&M | $34,994 |
| First Financial Bank | 10425 Harrison Avenue Harrison, OH 45030 | Full Service B&M | $94,968 |
| First Financial Bank | 1053 State Road 229 North Batesville, IN 47006 | Full Service B&M | $81,411 |
| First Financial Bank | 106 North Market Street North Manchester, IN 46962 | Full Service B&M | $68,566 |
| First Financial Bank | 108 South Main Street Monroe, OH 45050 | Full Service B&M | $51,402 |
| First Financial Bank | 11 South Meridian, Ste 101 Indianapolis, IN 46204 | Full Service B&M | $131,262 |
| First Financial Bank | 1101 Columbus Ave Lebanon, OH 45036 | Full Service B&M | $53,707 |
| First Financial Bank | 112 North Meridian Street Portland, IN 47371 | Full Service B&M | $70,406 |
| First Financial Bank | 113 Central Avenue Van Wert, OH 45891 | Limited, Drive-thru | $0 |
| First Financial Bank | 1130 East Tipton Street Seymour, IN 47274 | Full Service B&M | $106,081 |
| First Financial Bank | 1163 South Shannon Street Van Wert, OH 45891 | Full Service B&M | $109,458 |
| First Financial Bank | 117 South Jefferson Street Hartford City, IN 47348 | Limited, Drive-thru | $0 |
| First Financial Bank | 1180 W. 86th Street Indianapolis, IN 46260 | Full Service B&M | $82,731 |
| First Financial Bank | 120 North Monroe Street Williamsport, IN 47993 | Full Service B&M | $41,310 |
| First Financial Bank | 120 W. Second Street Dayton, OH 45402 | Full Service B&M | $60,447 |
| First Financial Bank | 122 West Washington Street Greensburg, IN 47240 | Limited, Drive-thru | $0 |
| First Financial Bank | 125 East State Street Trenton, OH 45067 | Full Service B&M | $78,871 |
| First Financial Bank | 125 Third Street Columbus, IN 47201 | Full Service B&M | $376,251 |
| First Financial Bank | 1263 North Indiana 135 Greenwood, IN 46142 | Full Service B&M | $24,286 |
| First Financial Bank | 130 East Spring Street Saint Marys, OH 45885 | Full Service B&M | $74,640 |
| First Financial Bank | 1315 Clifty Drive Madison, IN 47250 | Full Service B&M | $29,348 |
| First Financial Bank | 136 East Harriman Bargersville, IN 46106 | Full Service B&M | $51,882 |
| First Financial Bank | 136 Thornton Road Hanover, IN 47243 | Full Service B&M | $33,021 |
| First Financial Bank | 137 West Buckeye Street Clyde, OH 43410 | Full Service B&M | $43,487 |
| First Financial Bank | 13704 Shelbyville Road Louisville, KY 40245 | Full Service B&M | $49,625 |
| First Financial Bank | 139 S High Street Columbus, OH 43215 | Full Service B&M | $154,278 |
| First Financial Bank | 150 West Wilson Bridge Road Worthington, OH 43085 | Full Service B&M | $127,942 |
| First Financial Bank | 1580 West Main Street Troy, OH 45373 | Full Service B&M | $37,471 |
| First Financial Bank | 160 Berkeley Drive Hamilton, OH 45013 | Full Service B&M | $1,593 |
| First Financial Bank | 166 South Main Street Rockford, OH 45882 | Full Service B&M | $39,963 |
| First Financial Bank | 1734 Midland Trail Shelbyville, KY 40065 | Full Service B&M | $31,076 |
| First Financial Bank | 1850 Marketplace Boulevard Shelbyville, IN 46176 | Full Service B&M | $154,153 |
| First Financial Bank | 1901 North Lincoln Street Greensburg, IN 47240 | Full Service B&M | $51,010 |
| First Financial Bank | 1942 Havermann Road Celina, OH 45822 | Full Service B&M | $185,564 |
| First Financial Bank | 2000 West Court Street Kankakee, IL 60901 | Full Service B&M | $61,493 |
| First Financial Bank | 201 Limestone Drive Frankfort, KY 40601 | Full Service B&M | $14,116 |
| First Financial Bank | 201 N Main Street Paulding, OH 45879 | Full Service B&M | $60,927 |
| First Financial Bank | 201 North Broadway Greensburg, IN 47240 | Full Service B&M | $150,097 |
| First Financial Bank | 202 North Harrison Street Alexandria, IN 46001 | Full Service B&M | $47,143 |
| First Financial Bank | 202 North Main Street Delphos, OH 45833 | Full Service B&M | $60,492 |
| First Financial Bank | 211 West Oak Street Louisville, KY 40203 | Limited, Mobile/Seasonal Office | $2,275 |
| First Financial Bank | 215 East Main Street Delphi, IN 46923 | Full Service B&M | $41,831 |
| First Financial Bank | 216 South Fourth Street Watseka, IL 60970 | Full Service B&M | $25,560 |
| First Financial Bank | 220 North Wayne Street Fort Recovery, OH 45846 | Full Service B&M | $116,264 |
| First Financial Bank | 220 S. Newton St Goodland, IN 47948 | Full Service B&M | $51,230 |
| First Financial Bank | 221 E Main Street Crawfordsville, IN 47933 | Full Service B&M | $42,374 |
| First Financial Bank | 225 Pictoria Drive Springdale, OH 45246 | Full Service Cyber Office | $16,863 |
| First Financial Bank | 2253 State Road 54 East Linton, IN 47441 | Full Service B&M | $61,644 |
| First Financial Bank | 230 Main Street Rising Sun, IN 47040 | Full Service B&M | $41,210 |
| First Financial Bank | 2344 South Erie Highway Hamilton, OH 45011 | Full Service B&M | $85,495 |
| First Financial Bank | 24004 Stateline Road Lawrenceburg, IN 47025 | Full Service B&M | $43,103 |
| First Financial Bank | 255 East Fifth Street Cincinnati, OH 45202 | Full Service B&M | $1,348,461 |
| First Financial Bank | 260 W Central Ave Springboro, OH 45066 | Full Service B&M | $53,424 |
| First Financial Bank | 2611 Highway Avenue Highland, IN 46322 | Full Service B&M | $174,275 |
| First Financial Bank | 2652 North Bend Road Hebron, KY 41048 | Full Service B&M | $65,172 |
| First Financial Bank | 2680 East Main Street Bexley, OH 43209 | Full Service B&M | $108,323 |
| First Financial Bank | 2705 169th Street Hammond, IN 46323 | Full Service B&M | $87,547 |
| First Financial Bank | 2712 Vine Street Cincinnati, OH 45219 | Full Service B&M | $7,246 |
| First Financial Bank | 2735 Bardstown Road Louisville, KY 40205 | Full Service B&M | $31,400 |
| First Financial Bank | 2737 Central Avenue Columbus, IN 47201 | Full Service B&M | $156,855 |
| First Financial Bank | 2750 45th Street Highland, IN 46322 | Full Service B&M | $180,466 |
| First Financial Bank | 28287 State Route 1 West Harrison, IN 47060 | Full Service B&M | $28,239 |
| First Financial Bank | 2862 Frankfort Avenue Louisville, KY 40206 | Full Service B&M | $23,033 |
| First Financial Bank | 2891 W. Alex Bell Road Dayton, OH 45459 | Full Service B&M | $25,519 |
| First Financial Bank | 293 North Hubbards Lane Louisville, KY 40207 | Full Service B&M | $131,393 |
| First Financial Bank | 300 High Street Hamilton, OH 45011 | Full Service B&M | $201,084 |
| First Financial Bank | 300 North Main Street Middletown, OH 45042 | Full Service B&M | $87,588 |
| First Financial Bank | 3005 Northwest Boulevard Columbus, OH 43221 | Full Service B&M | $70,691 |
| First Financial Bank | 3205 East Third Street Bloomington, IN 47401 | Full Service B&M | $21,312 |
| First Financial Bank | 323 East Main Street Hoopeston, IL 60942 | Full Service B&M | $28,141 |
| First Financial Bank | 330 West National Road Englewood, OH 45322 | Full Service B&M | $66,134 |
| First Financial Bank | 3433 East Main Street Richmond, IN 47374 | Full Service B&M | $30,430 |
| First Financial Bank | 3442 Edwards Road Cincinnati, OH 45208 | Full Service B&M | $81,278 |
| First Financial Bank | 3535 East 96th Street, Suite 135 Indianapolis, IN 46240 | Full Service B&M | $28,590 |
| First Financial Bank | 3539 East 10th Street Jeffersonville, IN 47130 | Full Service B&M | $19,716 |
| First Financial Bank | 358 West Main Street Rossville, IN 46065 | Full Service B&M | $45,573 |
| First Financial Bank | 3580 Madison Pike Edgewood, KY 41017 | Full Service B&M | $51,398 |
| First Financial Bank | 3610 Grant Line Road New Albany, IN 47150 | Full Service B&M | $38,088 |
| First Financial Bank | 3669 Springdale Road Cincinnati, OH 45251 | Full Service B&M | $56,145 |
| First Financial Bank | 3723 Glenmore Ave Cincinnati, OH 45211 | Full Service B&M | $82,010 |
| First Financial Bank | 3880 West Presidential Way Edinburgh, IN 46124 | Full Service B&M | $43,010 |
| First Financial Bank | 3950 Jonathon Moore Pike Columbus, IN 47201 | Full Service B&M | $85,974 |
| First Financial Bank | 4079 Hamilton Cleves Road Fairfield, OH 45014 | Full Service B&M | $57,352 |
| First Financial Bank | 41 West Eads Pkwy Lawrenceburg, IN 47025 | Full Service B&M | $51,771 |
| First Financial Bank | 411 South Locust Street Oxford, OH 45056 | Full Service B&M | $125,568 |
| First Financial Bank | 417 Jefferson Street Madison, IN 47250 | Full Service B&M | $63,336 |
| First Financial Bank | 4391 Far Hills Avenue Kettering, OH 45429 | Full Service B&M | $104,577 |
| First Financial Bank | 450 West Lincoln Highway Schererville, IN 46375 | Full Service B&M | $204,724 |
| First Financial Bank | 50 Branigin Road Franklin, IN 46131 | Full Service B&M | $124,095 |
| First Financial Bank | 501 Clifty Drive Madison, IN 47250 | Full Service B&M | $79,950 |
| First Financial Bank | 521 North State Street North Vernon, IN 47265 | Full Service B&M | $81,755 |
| First Financial Bank | 5300 Pleasant Avenue Fairfield, OH 45014 | Full Service B&M | $154,375 |
| First Financial Bank | 536 N College Ave Bloomington, IN 47404 | Full Service B&M | $363,600 |
| First Financial Bank | 5361 Cornerstone North Blvd. Centerville, OH 45440 | Full Service B&M | $28,821 |
| First Financial Bank | 547 High Street Worthington, OH 43085 | Full Service B&M | $68,554 |
| First Financial Bank | 555 East Third Street Hobart, IN 46342 | Full Service B&M | $90,230 |
| First Financial Bank | 5550 Cheviot Road Cincinnati, OH 45239 | Full Service B&M | $55,081 |
| First Financial Bank | 5712 Bridgetown Rd. Cincinnati, OH 45248 | Full Service B&M | $74,654 |
| First Financial Bank | 585 Anderson Ferry Road Cincinnati, OH 45238 | Full Service B&M | $36,630 |
| First Financial Bank | 5974 W Ridge Road Gary, IN 46408 | Full Service B&M | $18,510 |
| First Financial Bank | 600 South Memorial Drive New Castle, IN 47362 | Full Service B&M | $72,801 |
| First Financial Bank | 6001 Hamilton Avenue Cincinnati, OH 45224 | Full Service B&M | $6,916 |
| First Financial Bank | 6060 South Gilmore Road Fairfield, OH 45014 | Full Service B&M | $88,220 |
| First Financial Bank | 630 Central Avenue Connersville, IN 47331 | Full Service B&M | $72,567 |
| First Financial Bank | 6300 Harrison Avenue Cincinnati, OH 45247 | Full Service B&M | $52,431 |
| First Financial Bank | 6325 Brandt Pike Huber Heights, OH 45424 | Full Service B&M | $49,171 |
| First Financial Bank | 635 South Market Street Troy, OH 45373 | Full Service B&M | $97,549 |
| First Financial Bank | 647 Fife Avenue Wilmington, OH 45177 | Full Service B&M | $44,509 |
| First Financial Bank | 6512 Bardstown Road Louisville, KY 40291 | Full Service B&M | $28,619 |
| First Financial Bank | 6801 Miami Avenue Cincinnati, OH 45243 | Full Service B&M | $51,151 |
| First Financial Bank | 6945 South Liberty Drive Liberty Township, OH 45044 | Full Service B&M | $74,502 |
| First Financial Bank | 707 Creekview Drive Columbus, IN 47201 | Full Service B&M | $71,940 |
| First Financial Bank | 720 Nw Washington Blvd Hamilton, OH 45013 | Full Service B&M | $108,116 |
| First Financial Bank | 7470 South Mason-Montgomery Road Mason, OH 45040 | Full Service B&M | $91,255 |
| First Financial Bank | 751 City Center Drive Carmel, IN 46032 | Full Service B&M | $135,330 |
| First Financial Bank | 7522 Hamilton Avenue Mount Healthy, OH 45231 | Full Service B&M | $54,760 |
| First Financial Bank | 7615 Reading Rd Cincinnati, OH 45237 | Full Service B&M | $28,020 |
| First Financial Bank | 7637 Beechmont Avenue Cincinnati, OH 45255 | Full Service B&M | $36,676 |
| First Financial Bank | 7700 State Road 64 Georgetown, IN 47122 | Full Service B&M | $55,567 |
| First Financial Bank | 7735 Montgomery Road Cincinnati, OH 45236 | Full Service B&M | $58,921 |
| First Financial Bank | 7795 Tylersville Road West Chester, OH 45069 | Full Service B&M | $43,084 |
| First Financial Bank | 815 South Breiel Boulevard Middletown, OH 45044 | Full Service B&M | $128,779 |
| First Financial Bank | 817 East Columbia Street Flora, IN 46929 | Full Service B&M | $43,993 |
| First Financial Bank | 8475 North State Road 9 Hope, IN 47246 | Full Service B&M | $35,350 |
| First Financial Bank | 8601 Landen Drive Maineville, OH 45039 | Full Service B&M | $89,776 |
| First Financial Bank | 8740 South Emerson Avenue Indianapolis, IN 46237 | Full Service B&M | $37,565 |
| First Financial Bank | 9014 State Road 101 Brookville, IN 47012 | Full Service B&M | $62,603 |
| First Financial Bank | 9050 East 56th Street Indianapolis, IN 46216 | Full Service B&M | $48,868 |
| First Financial Bank | 9120 Union Centre Boulevard West Chester, OH 45069 | Full Service B&M | $196,217 |
| First Financial Bank | 926 East Mcmillan Street Cincinnati, OH 45206 | Full Service B&M | $550 |
| First Financial Bank | 9306 Taylorsville Road Louisville, KY 40299 | Full Service B&M | $24,860 |
| First Financial Bank | 936 North Main Street Crown Point, IN 46307 | Full Service B&M | $123,144 |
| First Financial Bank | 9554 E Us Highway 36 Avon, IN 46123 | Full Service B&M | $69,133 |
| First Financial Bank | Limaburg Road And Jones Circle Burlington, KY 41005 | Full Service B&M | $106,541 |
For 2020, First Financial Bank had 146 branches.
Yearly Performance Overview
Bank Income
| Item | Value (in 000's) |
|---|---|
| Total interest income | $524,947 |
| Net interest income | $470,569 |
| Total noninterest income | $171,505 |
| Gross Fiduciary activities income | $16,531 |
| Service charges on deposit accounts | $29,446 |
| Trading account gains and fees | $0 |
| Additional Noninterest Income | $125,528 |
| Pre-tax net operating income | $195,990 |
| Securities gains (or losses, -) | $13,336 |
| Income before extraordinary items | $174,851 |
| Discontinued Operations (Extraordinary gains, net) | $0 |
| Net income of bank and minority interests | $174,851 |
| Minority interest net income | $10 |
| Net income | $174,841 |
| Sale, conversion, retirement of capital stock, net | $0 |
| Net operating income | $163,648 |
First Financial Bank's gross interest income from loans was $524,947,000.
First Financial Bank's net interest income from loans was $470,569,000.
First Financial Bank's fee based income from loans was $29,446,000.
First Financial Bank's net income from loans was $174,841,000.
Bank Expenses
| Item | Value (in 000's) |
|---|---|
| Total interest expense | $54,378 |
| Provision for credit losses | $70,796 |
| Total noninterest expense | $375,288 |
| Salaries and employee benefits | $228,775 |
| Premises and equipment expense | $38,217 |
| Additional noninterest expense | $108,296 |
| Applicable income taxes | $34,475 |
| Net charge-offs | $14,273 |
| Cash dividends | $80,000 |
First Financial Bank's interest expense for loans was $54,378,000.
First Financial Bank's payroll and benefits expense were $228,775,000.
First Financial Bank's property, plant and equipment expenses $38,217,000.
Loan Performance
| Type of Loan | % of Loans Noncurrent (30+ days, end of period snapshot) |
|---|---|
| All loans | 0.0% |
| Real Estate loans | 0.0% |
| Construction & Land Development loans | 0.0% |
| Nonfarm, nonresidential loans | 0.0% |
| Multifamily residential loans | 0.0% |
| 1-4 family residential loans | 0.0% |
| HELOC loans | 0.0% |
| All other family | 0.0% |
| Commercial & industrial loans | 1.0% |
| Personal loans | 0.0% |
| Credit card loans | 0.6% |
| Other individual loans | 0.0% |
| Auto loans | 0.0% |
| Other consumer loans | 0.0% |
| Unsecured commercial real estate loans | 0.0% |
Deposits
| Type | Value (in 000's) |
|---|---|
| Total deposits | $12,408,670 |
| Deposits held in domestic offices | $12,408,670 |
| Deposits by Individuals, partnerships, and corporations | $10,579,725 |
| Deposits by U.S. Government | $0 |
| Deposits by States and political subdivisions in the U.S. | $1,828,282 |
| Deposits by Commercial banks and other depository institutions in U.S. | $662 |
| Deposits by Banks in foreign countries | $0 |
| Deposits by Foreign governments and official institutions | $0 |
| Transaction accounts | $3,250,973 |
| Demand deposits | $3,072,579 |
| Nontransaction accounts | $9,157,696 |
| Money market deposit accounts (MMDAs) | $6,153,466 |
| Other savings deposits (excluding MMDAs) | $1,130,625 |
| Total time deposits | $1,873,606 |
| Total time and savings deposits | $9,336,090 |
| Noninterest-bearing deposits | $3,940,376 |
| Interest-bearing deposits | $8,468,294 |
| Retail deposits | $11,511,400 |
| IRAs and Keogh plan accounts | $238,411 |
| Brokered deposits | $676,815 |
| Deposits held in foreign offices | $0 |
Assets
| Asset | Value (in 000's) |
|---|---|
| Total Assets | $15,898,051 |
| Cash & Balances due from depository institutions | $245,738 |
| Interest-bearing balances | $42,222 |
| Total securities | $3,577,164 |
| Federal funds sold & reverse repurchase | $0 |
| Net loans and leases | $9,766,394 |
| Loan and leases loss allowance | $175,679 |
| Trading account assets | $0 |
| Bank premises and fixed assets | $269,772 |
| Other real estate owned | $1,287 |
| Goodwill and other intangibles | $950,925 |
| All other assets | $1,086,771 |
Liabilities
| Liabilities | Value (in 000's) |
|---|---|
| Total liabilities and capital | $15,898,050 |
| Total Liabilities | $13,553,278 |
| Total deposits | $12,408,670 |
| Interest-bearing deposits | $8,468,294 |
| Deposits held in domestic offices | $12,408,670 |
| % insured (estimated) | $55 |
| Federal funds purchased and repurchase agreements | $166,594 |
| Trading liabilities | $0 |
| Other borrowed funds | $457,587 |
| Subordinated debt | $7,500 |
| All other liabilities | $512,927 |
Issued Loan Types
| Type | Value (in 000's) |
|---|---|
| Net loans and leases | $9,766,394 |
| Loan and leases loss allowance | $175,679 |
| Total loans and leases (domestic) | $9,942,073 |
| All real estate loans | $6,660,329 |
| Real estate loans in domestic offices | $6,660,329 |
| Construction and development loans | $467,097 |
| Residential 1-4 family construction | $78,403 |
| Other construction, all land development and other land | $388,694 |
| Loans secured by nonfarm nonresidential properties | $3,353,123 |
| Nonfarm nonresidential secured by owner-occupied properties | $924,489 |
| Commercial real estate & other non-farm, non-residential | $2,428,634 |
| Multifamily residential real estate | $822,285 |
| 1-4 family residential loans | $1,917,491 |
| Farmland loans | $100,333 |
| Loans held in foreign offices | $0 |
| Farm loans | $53,342 |
| Commercial and industrial loans | $2,729,232 |
| To non-U.S. addressees | $0 |
| Loans to individuals | $97,833 |
| Credit card loans | $22,773 |
| Related Plans | $4,127 |
| Consumer Auto Loans | $25,483 |
| Other loans to individuals | $45,450 |
| All other loans & leases | $401,337 |
| Loans to foreign governments and official institutions | $0 |
| Other loans | $198,381 |
| Loans to depository institutions and acceptances of other banks | $0 |
| Loans not secured by real estate | $154,590 |
| Loans secured by real estate to non-U.S. addressees | $0 |
| Restructured Loans & leases | $6,108 |
| Non 1-4 family restructured loans & leases | $1,726 |
| Total loans and leases (foreign) | $0 |
First Financial Bank had $9,766,394,000 of loans outstanding in 2020. $6,660,329,000 of loans were in real estate loans. $467,097,000 of loans were in development loans. $822,285,000 of loans were in multifamily mortgage loans. $1,917,491,000 of loans were in 1-4 family mortgage loans. $53,342,000 of loans were in farm loans. $22,773,000 of loans were in credit card loans. $25,483,000 of loans were in the auto loan category.
Small Business Loans
| Categorization | # of Loans in Category | $ amount of loans (in 000's) | Average $/loan |
|---|---|---|---|
| Nonfarm, nonresidential loans - <$1MM | 2,442 | $553,962 | $226,848 |
| Nonfarm, nonresidential loans - <$100k | 439 | $16,747 | $38,148 |
| Nonfarm, nonresidential loans - $100-250k | 750 | $80,890 | $107,853 |
| Nonfarm, nonresidential loans - $250k-1MM | 1,253 | $456,325 | $364,186 |
| Commercial & Industrial, US addressed loans - <$1MM | 10,375 | $855,171 | $82,426 |
| Commercial & Industrial, US addressed loans - <$100k | 7,204 | $163,982 | $22,763 |
| Commercial & Industrial, US addressed loans - $100-250k | 1,585 | $170,907 | $107,828 |
| Commercial & Industrial, US addressed loans - $250k-1MM | 1,586 | $520,282 | $328,047 |
| Farmland loans - <$1MM | 410 | $46,541 | $113,515 |
| Farmland loans - <$100k | 118 | $3,369 | $28,551 |
| Farmland loans - $100-250k | 195 | $19,455 | $99,769 |
| Farmland loans - $250k-1MM | 97 | $23,717 | $244,505 |
| Agriculture operations loans - <$1MM | 575 | $27,062 | $47,064 |
| Agriculture operations loans - <$100k | 443 | $8,428 | $19,025 |
| Agriculture operations loans - $100-250k | 85 | $8,141 | $95,776 |
| Agriculture operations loans - $250k-1MM | 47 | $10,493 | $223,255 |