Towne Bank Mortgage Rates, Fees & Info
Portsmouth, VALEI: 54930039UO39UJGI7078
Tax ID: 54-1910608
Latest/2024 | 2023 Data | 2022 Data | 2021 Data | 2020 Data | 2019 Data | 2018 Data
Jump to:
Mortgage Data
Bank Data
Review & Overview
Towne Bank is a mid-sized bank specializing in Home Purchase and Refi loans. Towne Bank has a high proportion of conventional loans. They have an average proportion of FHA loans. They have a low ratio of USDA loans. They have a a low proportion of FHA loans. (This may mean they shy away from first time homebuyers.) They have a a low proportion of FHA loans. (This may mean they shy away from first time homebuyers.) They have a a low proportion of FHA loans. (This may mean they shy away from first time homebuyers.) Their top markets by origination volume include: Washington, Virginia Beach, Baltimore, Charlotte, and Raleigh among others. We have data for 115 markets. (Some data included below & more in-depth data is available with an active subscription.)Towne Bank has an above average approval rate when compared to the average across all lenders. They have a below average pick rate when compared to similar lenders. Towne Bank is typically a low fee lender. (We use the term "fees" to include things like closing costs and other costs incurred by borrowers-- whether they are paid out of pocket or rolled into the loan.) They typically have about average rates.
We show data for every lender and do not change our ratings-- even if an organization is a paid advertiser. Our consensus data does have lag, but it is highly correlated to a lender's rates & fees relative to their markets. This means that if a bank is a low fee/rate lender the past-- chances are they are still one today. Our SimulatedRates™ use advanced statistical techniques to forecast different rates based on a lender's historical data.
Mortgage seekers: Choose your metro area here to explore the lowest fee & rate lenders.
Mortgage professionals: We have various tools to make your lives easier. Contact us to see how we can help with your market research, analytics or advertising needs.
SimulatedRates™Mortgage Type |
Simulated Rate | Simulation Date |
|---|---|---|
| Home Equity Line of Credit (HELOC) | 6.72% | 7/9/26 |
| 30 Year Conventional Purchase | 6.96% | 7/9/26 |
| 30 Year Conventional Refi | 6.89% | 7/9/26 |
| 30 Year Cash-out Refi | 7.08% | 7/9/26 |
| 30 Year FHA Purchase | 7.12% | 7/9/26 |
| 30 Year FHA Refi | 6.64% | 7/9/26 |
| 30 Year VA Purchase | 6.38% | 7/9/26 |
| 30 Year VA Refi | 6.07% | 7/9/26 |
| 30 Year USDA Purchase | 6.77% | 7/9/26 |
| 15 Year Conventional Purchase | 5.97% | 7/9/26 |
| 15 Year Conventional Refi | 5.96% | 7/9/26 |
| 15 Year Cash-out Refi | 5.96% | 7/9/26 |
| 15 Year VA Purchase | 4.98% | 7/9/26 |
| 15 Year VA Refi | 5.35% | 7/9/26 |
| These are simulated rates generated by our proprietary machine learning models. These are not guaranteed by the bank. They are our estimates based on a lender's past behaviors combined with current market conditions. Contact an individual lender for their actual rates. Our models use fixed rate terms for conforming loans, 700+ FICO, 10% down for FHA and 20% for conventional. These are based on consensus, historical data-- not advertised promotional rates. | ||
Towne Bank Mortgage Calculator
Your Estimates
Estimated Loan Payment: Update the calculator values and click calculate payment!
This is not an official calculator from Towne Bank. It uses our SimulatedRate™
technology, basic math and reasonable assumptions to calculate mortgage payments derived from our simulations and your inputs.
The default purchase price is the median sales price across the US for 2022Q4, per FRED.
Originations
15,004Origination Dollar Volume (All Markets)
$4,843,920,000Employee count
2,448Awards


Towne Bank - 2020
Towne Bank is a 2020 , due to their low .
For 2020, less than of lenders were eligible for this award.
Work for Towne Bank?
Use this award on your own site. Either save and use the images below, or pass the provided image embed code to your development team.
Top Markets
Zoom/scroll map to see bank's per metro statistics. Subscribers can configure state/metro/county granularity, assorted fields and quantity of results. This map shows top 10 markets in the map viewport, as defined by descending origination volume.
| Market | Originations | Total Value | Average Loan | Average Fees | Average Rate |
|---|---|---|---|---|---|
| Washington-Arlington-Alexandria, DC-VA-MD-WV (FHA|USDA|VA) | 4,048 | $1,536,710,000 | $379,622 | $5,235 | 2.98% |
| VIRGINIA BEACH-NORFOLK-NEWPORT NEWS, VA-NC (FHA|USDA|VA) | 2,902 | $871,450,000 | $300,293 | $5,286 | 3.44% |
| BALTIMORE-COLUMBIA-TOWSON, MD (FHA|USDA|VA) | 2,462 | $785,800,000 | $319,171 | $4,750 | 2.97% |
| CHARLOTTE-CONCORD-GASTONIA, NC-SC (FHA|USDA|VA) | 937 | $307,305,000 | $327,967 | $5,368 | 3.14% |
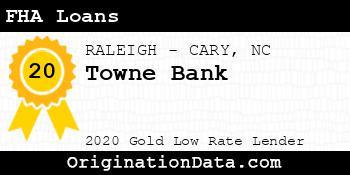
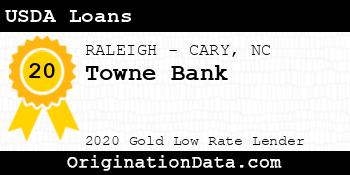
| RALEIGH-CARY, NC (FHA|USDA|VA) | 760 | $255,530,000 | $336,224 | $5,628 | 3.10% |
| RICHMOND, VA (FHA|USDA|VA) | 993 | $234,715,000 | $236,370 | $5,331 | 3.22% |
| WILMINGTON, NC (FHA|USDA|VA) | 462 | $154,380,000 | $334,156 | $4,185 | 3.18% |
| Kill Devil Hills, NC (FHA|USDA|VA) | 344 | $109,710,000 | $318,924 | $4,128 | 3.41% |
| CALIFORNIA-LEXINGTON PARK, MD (FHA|USDA|VA) | 326 | $99,920,000 | $306,503 | $5,466 | 2.91% |
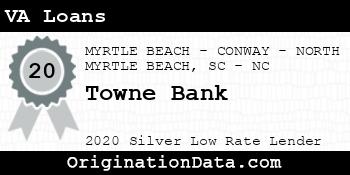
| MYRTLE BEACH-CONWAY-NORTH MYRTLE BEACH, SC-NC (FHA|USDA|VA) | 242 | $76,300,000 | $315,289 | $3,965 | 3.17% |
| Outside of Metro Areas | 249 | $62,175,000 | $249,699 | $4,655 | 3.18% |
| DURHAM-CHAPEL HILL, NC (FHA|USDA|VA) | 105 | $39,885,000 | $379,857 | $4,854 | 3.26% |
| GREENVILLE, NC (FHA|USDA|VA) | 179 | $37,425,000 | $209,078 | $3,782 | 3.31% |
| SALISBURY, MD-DE (FHA|USDA|VA) | 127 | $36,115,000 | $284,370 | $4,243 | 2.98% |
| HAGERSTOWN-MARTINSBURG, MD-WV (FHA|USDA|VA) | 94 | $22,660,000 | $241,064 | $5,149 | 2.94% |
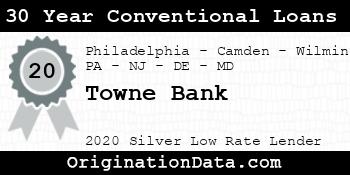
| Philadelphia-Camden-Wilmington, PA-NJ-DE-MD (FHA|USDA|VA) | 49 | $13,275,000 | $270,918 | $5,113 | 2.91% |
| GREENSBORO-HIGH POINT, NC (FHA|USDA|VA) | 38 | $13,070,000 | $343,947 | $3,841 | 3.27% |
| Elizabeth City, NC (FHA|USDA|VA) | 64 | $10,750,000 | $167,969 | $5,003 | 3.23% |
| CHARLESTON-NORTH CHARLESTON, SC (FHA|USDA|VA) | 18 | $9,920,000 | $551,111 | $5,854 | 3.15% |
| Washington, NC (FHA|USDA|VA) | 43 | $9,465,000 | $220,116 | $3,610 | 3.25% |
| YORK-HANOVER, PA (FHA|USDA|VA) | 43 | $9,205,000 | $214,070 | $4,667 | 2.88% |
| FAYETTEVILLE, NC (FHA|USDA|VA) | 43 | $8,815,000 | $205,000 | $5,586 | 2.68% |
| Morehead City, NC (FHA|USDA|VA) | 20 | $8,100,000 | $405,000 | $4,171 | 3.39% |
| CHARLOTTESVILLE, VA (FHA|USDA|VA) | 23 | $8,025,000 | $348,913 | $5,614 | 3.23% |
| ATLANTA-SANDY SPRINGS-ALPHARETTA, GA (FHA|USDA|VA) | 21 | $6,705,000 | $319,286 | $4,073 | 2.78% |
| TAMPA-ST. PETERSBURG-CLEARWATER, FL (FHA|USDA|VA) | 18 | $6,230,000 | $346,111 | $4,048 | 3.09% |
| Boone, NC (FHA|USDA|VA) | 13 | $5,155,000 | $396,538 | $4,161 | 3.27% |
| Easton, MD (FHA|USDA|VA) | 15 | $5,115,000 | $341,000 | $4,498 | 3.04% |
| NASHVILLE-DAVIDSON-MURFREESBORO-FRANKLIN, TN (FHA|USDA|VA) | 16 | $4,800,000 | $300,000 | $4,178 | 3.04% |
| WINSTON-SALEM, NC (FHA|USDA|VA) | 18 | $4,750,000 | $263,889 | $3,709 | 3.19% |
| JACKSONVILLE, NC (FHA|USDA|VA) | 19 | $4,345,000 | $228,684 | $3,279 | 3.28% |
| ASHEVILLE, NC (FHA|USDA|VA) | 15 | $4,335,000 | $289,000 | $4,322 | 3.23% |
| Miami-Fort Lauderdale-Pompano Beach, FL (FHA|USDA|VA) | 16 | $4,130,000 | $258,125 | $4,771 | 3.20% |
| WINCHESTER, VA-WV (FHA|USDA|VA) | 12 | $3,850,000 | $320,833 | $3,775 | 3.03% |
| BURLINGTON, NC (FHA|USDA|VA) | 5 | $3,795,000 | $759,000 | $3,025 | 2.88% |
| Roanoke Rapids, NC (FHA|USDA|VA) | 8 | $3,290,000 | $411,250 | $5,762 | 3.56% |
| CHAMBERSBURG-WAYNESBORO, PA (FHA|USDA|VA) | 13 | $3,215,000 | $247,308 | $5,535 | 2.92% |
| CAPE CORAL-FORT MYERS, FL (FHA|USDA|VA) | 7 | $2,865,000 | $409,286 | $4,862 | 2.79% |
| NEW BERN, NC (FHA|USDA|VA) | 9 | $2,735,000 | $303,889 | $5,218 | 2.59% |
| GETTYSBURG, PA (FHA|USDA|VA) | 11 | $2,565,000 | $233,182 | $5,318 | 2.94% |
| HICKORY-LENOIR-MORGANTON, NC (FHA|USDA|VA) | 6 | $2,540,000 | $423,333 | $4,332 | 3.52% |
| PENSACOLA-FERRY PASS-BRENT, FL (FHA|USDA|VA) | 9 | $2,425,000 | $269,444 | $3,548 | 2.79% |
| ROANOKE, VA (FHA|USDA|VA) | 7 | $2,295,000 | $327,857 | $3,274 | 3.07% |
| PALM BAY-MELBOURNE-TITUSVILLE, FL (FHA|USDA|VA) | 6 | $2,180,000 | $363,333 | $7,060 | 3.40% |
| Cambridge, MD (FHA|USDA|VA) | 9 | $1,965,000 | $218,333 | $7,560 | 2.67% |
| GREENVILLE-ANDERSON, SC (FHA|USDA|VA) | 4 | $1,910,000 | $477,500 | $4,530 | 3.72% |
| HILTON HEAD ISLAND-BLUFFTON, SC (FHA|USDA|VA) | 4 | $1,870,000 | $467,500 | $10,249 | 2.69% |
| NAPLES-MARCO ISLAND, FL (FHA|USDA|VA) | 5 | $1,715,000 | $343,000 | $3,977 | 3.00% |
| Albemarle, NC (FHA|USDA|VA) | 9 | $1,695,000 | $188,333 | $5,885 | 3.22% |
| Key West, FL (FHA|USDA|VA) | 2 | $1,660,000 | $830,000 | $10,051 | 3.25% |
| HARRISBURG-CARLISLE, PA (FHA|USDA|VA) | 7 | $1,635,000 | $233,571 | $3,877 | 3.00% |
| LYNCHBURG, VA (FHA|USDA|VA) | 11 | $1,625,000 | $147,727 | $3,535 | 3.03% |
| North Port-Sarasota-Bradenton, FL (FHA|USDA|VA) | 7 | $1,595,000 | $227,857 | $3,169 | 3.63% |
| JACKSONVILLE, FL (FHA|USDA|VA) | 4 | $1,530,000 | $382,500 | $4,435 | 3.00% |
| PITTSBURGH, PA (FHA|USDA|VA) | 6 | $1,390,000 | $231,667 | $4,631 | 2.94% |
| Sanford, NC (FHA|USDA|VA) | 5 | $1,175,000 | $235,000 | $5,769 | 2.98% |
| ROCKY MOUNT, NC (FHA|USDA|VA) | 8 | $1,160,000 | $145,000 | $4,000 | 2.72% |
| GOLDSBORO, NC (FHA|USDA|VA) | 5 | $1,135,000 | $227,000 | $4,866 | 2.85% |
| LANCASTER, PA (FHA|USDA|VA) | 4 | $1,080,000 | $270,000 | $4,075 | 3.09% |
| ALLENTOWN-BETHLEHEM-EASTON, PA-NJ (FHA|USDA|VA) | 4 | $1,040,000 | $260,000 | $4,221 | 2.88% |
| Pinehurst-Southern Pines, NC (FHA|USDA|VA) | 3 | $1,035,000 | $345,000 | $3,728 | 3.17% |
| STAUNTON, VA (FHA|USDA|VA) | 4 | $1,010,000 | $252,500 | $5,203 | 2.81% |
| STATE COLLEGE, PA (FHA|USDA|VA) | 1 | $905,000 | $905,000 | $4,677 | 2.75% |
| ORLANDO-KISSIMMEE-SANFORD, FL (FHA|USDA|VA) | 3 | $895,000 | $298,333 | $2,704 | 3.04% |
| BLACKSBURG-CHRISTIANSBURG, VA (FHA|USDA|VA) | 4 | $750,000 | $187,500 | $3,766 | 3.69% |
| Kinston, NC (FHA|USDA|VA) | 4 | $750,000 | $187,500 | $3,911 | 3.18% |
| Sebastian-Vero Beach, FL (FHA|USDA|VA) | 2 | $720,000 | $360,000 | $3,763 | 3.00% |
| Cullowhee, NC (FHA|USDA|VA) | 3 | $695,000 | $231,667 | $3,308 | 3.46% |
| JOHNSON CITY, TN (FHA|USDA|VA) | 2 | $670,000 | $335,000 | $4,030 | 3.06% |
| DOVER, DE (FHA|USDA|VA) | 4 | $660,000 | $165,000 | $3,598 | 2.25% |
| Laurinburg, NC (FHA|USDA|VA) | 2 | $660,000 | $330,000 | $3,665 | 3.56% |
| PUNTA GORDA, FL (FHA|USDA|VA) | 3 | $605,000 | $201,667 | $3,391 | 2.96% |
| CRESTVIEW-FORT WALTON BEACH-DESTIN, FL (FHA|USDA|VA) | 2 | $590,000 | $295,000 | $3,221 | 3.92% |
| BRUNSWICK, GA (FHA|USDA|VA) | 2 | $580,000 | $290,000 | $5,689 | 3.44% |
| Wilson, NC (FHA|USDA|VA) | 3 | $545,000 | $181,667 | $4,727 | 2.71% |
| CHATTANOOGA, TN-GA (FHA|USDA|VA) | 3 | $535,000 | $178,333 | $3,165 | 3.21% |
| Seneca, SC (FHA|USDA|VA) | 1 | $505,000 | $505,000 | $0 | 2.75% |
| DENVER-AURORA-LAKEWOOD, CO (FHA|USDA|VA) | 1 | $505,000 | $505,000 | $0 | 4.00% |
| Sevierville, TN (FHA|USDA|VA) | 1 | $495,000 | $495,000 | $4,453 | 3.38% |
| MEMPHIS, TN-MS-AR (FHA|USDA|VA) | 2 | $490,000 | $245,000 | $3,546 | 3.31% |
| AUGUSTA-RICHMOND COUNTY, GA-SC (FHA|USDA|VA) | 3 | $485,000 | $161,667 | $6,990 | 2.67% |
| ALTOONA, PA (FHA|USDA|VA) | 1 | $445,000 | $445,000 | $10,320 | 2.63% |
| PANAMA CITY, FL (FHA|USDA|VA) | 2 | $440,000 | $220,000 | $3,832 | 2.94% |
| COLUMBIA, SC (FHA|USDA|VA) | 2 | $420,000 | $210,000 | $6,436 | 2.63% |
| HARRISONBURG, VA (FHA|USDA|VA) | 2 | $400,000 | $200,000 | $2,418 | 2.69% |
| OCALA, FL (FHA|USDA|VA) | 1 | $375,000 | $375,000 | $4,067 | 3.13% |
| ATHENS-CLARKE COUNTY, GA (FHA|USDA|VA) | 1 | $315,000 | $315,000 | $2,973 | 2.75% |
| WILLIAMSPORT, PA (FHA|USDA|VA) | 1 | $305,000 | $305,000 | $4,265 | 2.63% |
| GAINESVILLE, FL (FHA|USDA|VA) | 1 | $305,000 | $305,000 | $7,508 | 2.25% |
| SAVANNAH, GA (FHA|USDA|VA) | 1 | $285,000 | $285,000 | $9,231 | 2.75% |
| Georgetown, SC (FHA|USDA|VA) | 1 | $275,000 | $275,000 | $4,297 | 2.88% |
| SCRANTON--WILKES-BARRE, PA (FHA|USDA|VA) | 1 | $265,000 | $265,000 | $4,818 | 2.63% |
| Marion, NC (FHA|USDA|VA) | 1 | $265,000 | $265,000 | $5,866 | 2.50% |
| Shelby, NC (FHA|USDA|VA) | 3 | $255,000 | $85,000 | $7,810 | 1.71% |
| READING, PA (FHA|USDA|VA) | 1 | $255,000 | $255,000 | $4,199 | 3.00% |
| PORT ST. LUCIE, FL (FHA|USDA|VA) | 1 | $245,000 | $245,000 | $2,483 | 3.25% |
| CUMBERLAND, MD-WV (FHA|USDA|VA) | 2 | $240,000 | $120,000 | $3,140 | 2.94% |
| AUSTIN-ROUND ROCK-GEORGETOWN, TX (FHA|USDA|VA) | 1 | $225,000 | $225,000 | $0 | 3.50% |
| Forest City, NC (FHA|USDA|VA) | 2 | $220,000 | $110,000 | $0 | 3.75% |
| THE VILLAGES, FL (FHA|USDA|VA) | 1 | $205,000 | $205,000 | $6,011 | 3.13% |
| DELTONA-DAYTONA BEACH-ORMOND BEACH, FL (FHA|USDA|VA) | 1 | $175,000 | $175,000 | $3,069 | 2.75% |
| CLARKSVILLE, TN-KY (FHA|USDA|VA) | 1 | $175,000 | $175,000 | $3,228 | 4.00% |
| Lewisburg, TN (FHA|USDA|VA) | 1 | $165,000 | $165,000 | $3,145 | 3.38% |
| FLORENCE, SC (FHA|USDA|VA) | 1 | $155,000 | $155,000 | $5,804 | 3.25% |
| St. Marys, GA (FHA|USDA|VA) | 1 | $145,000 | $145,000 | $0 | 3.63% |
| New York-Newark-Jersey City, NY-NJ-PA (FHA|USDA|VA) | 1 | $145,000 | $145,000 | $3,086 | 3.25% |
| MORGANTOWN, WV (FHA|USDA|VA) | 1 | $145,000 | $145,000 | $3,284 | 4.13% |
| Henderson, NC (FHA|USDA|VA) | 2 | $130,000 | $65,000 | $0 | 2.00% |
| HUNTINGTON-ASHLAND, WV-KY-OH (FHA|USDA|VA) | 1 | $105,000 | $105,000 | $2,651 | 2.75% |
| North Wilkesboro, NC (FHA|USDA|VA) | 1 | $105,000 | $105,000 | $3,413 | 3.50% |
| Danville, VA (FHA|USDA|VA) | 1 | $105,000 | $105,000 | $1,734 | 3.38% |
| KINGSPORT-BRISTOL, TN-VA (FHA|USDA|VA) | 1 | $105,000 | $105,000 | $3,652 | 3.13% |
| LEBANON, PA (FHA|USDA|VA) | 1 | $95,000 | $95,000 | $2,040 | 2.75% |
| Lumberton, NC (FHA|USDA|VA) | 1 | $75,000 | $75,000 | $3,581 | 3.25% |
| ERIE, PA (FHA|USDA|VA) | 1 | $65,000 | $65,000 | $4,171 | 3.00% |
Similar Lenders
We use machine learning to identify the top lenders compared against Towne Bank based on their rates and fees, along with other useful metrics. A lower similarity rank signals a stronger match.
Similarity Rank: 72
Similarity Rank: 90
Similarity Rank: 372
Similarity Rank: 384
Similarity Rank: 496
Similarity Rank: 589
Similarity Rank: 625
Similarity Rank: 640
Similarity Rank: 680
Similarity Rank: 680
Product Mix
For 2020, Towne Bank's most frequently originated type of loan was Conventional, with 10,611 originations. Their 2nd most popular type was VA, with 1,999 originations.
Loan Reason
For 2020, Towne Bank's most frequently cited loan purpose was Home Purchase, with 7,885 originations. The 2nd most popular reason was Refi, with 5,365 originations.
Loan Duration/Length
For 2020, Towne Bank's most frequently cited loan duration was 30 Year, with 11,899 originations. The 2nd most popular length was 15 Year, with 926 originations.
Origination Fees/Closing Costs
Towne Bank's average total fees were $5,176, while their most frequently occuring range of origination fees (closing costs) were in the $1k-2k bucket, with 8,116 originations.
Interest Rates
During 2020, Towne Bank's average interest rate for loans was 3.09%, while their most frequently originated rate bucket for loans was 3-4%, with 6,484 originations.
Loan Sizing
2020 saw Towne Bank place emphasis on $200k-400k loans with 7,670 originations, totaling $2,234,550,000 in origination value.
Applicant Income
Towne Bank lent most frequently to those with incomes in the $100k-150k range, with 3,153 originations. The second most popular income band? $50k-75k, with 2,761 originations.
Applicant Debt to Income Ratio
Towne Bank lent most frequently to those with DTI ratios of 20-30%, with 3,263 originations. The next most common DTI ratio? 30-36%, with 2,614 originations.
Ethnicity Mix
Approval Rates
Total approvals of all applications97.56%
Towne Bank has an exceptionally high approval rate. They either target their audience very well or may have lax underwriting protocols.
Pick Rate
Approvals leading to origination84.40%
Towne Bank has a below average pick rate.
Points and Fees
| Points | Originations | Total Value | Average Loan |
|---|---|---|---|
| NA | 15,004 | $4,843,920,000 | $322,842 |
Occupancy Type Mix
LTV Distribution
Complaints
| Bank Name | Product | Issue | 2020 CPFB Complaints | % of Total Issues |
|---|---|---|---|---|
| TOWNEBANK | Conventional home mortgage | Trouble during payment process | 3 | 100.0% |
Bank Details
Branches
| Bank Name | Branch | Branch Type | Deposits (000's) |
|---|---|---|---|
| Towne Bank | 2 Juniper Trail Southern Shores, NC 27949 | Full Service B&M | $319,330 |
| Towne Bank | 9000 West Huguenot Road Richmond, VA 23235 | Full Service B&M | $125,546 |
| Towne Bank | 9761 Iron Bridge Road Chesterfield, VA 23832 | Full Service B&M | $103,394 |
| Towne Bank | 5100 Nine Mile Road Richmond, VA 23223 | Full Service B&M | $39,207 |
| Towne Bank | 800 E. Canal St, Suite 100 Richmond, VA 23219 | Full Service B&M | $250,853 |
| Towne Bank | 178 Hwy 158 W Camden, NC 27921 | Full Service B&M | $58,407 |
| Towne Bank | 1510 Quarterpath Road Williamsburg, VA 23185 | Full Service B&M | $127,261 |
| Towne Bank | 1 Colley Avenue, Suite 100 Norfolk, VA 23510 | Full Service B&M | $79,515 |
| Towne Bank | 1 Old Oyster Point Road, Suite 100 Newport News, VA 23602 | Full Service B&M | $652,974 |
| Towne Bank | 1006 Colley Avenue Norfolk, VA 23507 | Full Service B&M | $123,652 |
| Towne Bank | 101 W Main St, Ste 1000 Norfolk, VA 23510 | Limited, Administrative | $0 |
| Towne Bank | 109 East Main Street Norfolk, VA 23510 | Full Service B&M | $897,788 |
| Towne Bank | 11001 Warwick Boulevard Newport News, VA 23601 | Full Service B&M | $199,855 |
| Towne Bank | 1203 Duck Road Duck, NC 27949 | Full Service B&M | $39,186 |
| Towne Bank | 1312 Greenbrier Parkway Chesapeake, VA 23320 | Full Service B&M | $858,246 |
| Towne Bank | 137 Mount Pleasant Road Chesapeake, VA 23322 | Full Service B&M | $275,625 |
| Towne Bank | 200 High Street Portsmouth, VA 23704 | Full Service B&M | $211,863 |
| Towne Bank | 250 Caratoke Highway Moyock, NC 27958 | Full Service B&M | $141,380 |
| Towne Bank | 2525 S. Croatan Hwy Nags Head, NC 27959 | Full Service B&M | $89,204 |
| Towne Bank | 2539 Princess Anne Road Virginia Beach, VA 23456 | Full Service B&M | $118,282 |
| Towne Bank | 2839 Charles Boulevard Greenville, NC 27858 | Full Service B&M | $132,306 |
| Towne Bank | 297 Constitution Drive Virginia Beach, VA 23462 | Full Service B&M | $549,413 |
| Towne Bank | 3100 Shore Drive Virginia Beach, VA 23451 | Limited, Mobile/Seasonal Office | $20,180 |
| Towne Bank | 3535 Glenwood Avenue Raleigh, NC 27612 | Full Service B&M | $947,408 |
| Towne Bank | 4501 Cox Road Glen Allen, VA 23060 | Full Service B&M | $256,801 |
| Towne Bank | 4901 Libbie Mill East Boulevard Richmond, VA 23230 | Full Service B&M | $108,476 |
| Towne Bank | 5000 Valleystone Dr., Ste110 Cary, NC 27519 | Full Service B&M | $172,110 |
| Towne Bank | 5200 Providence Road Virginia Beach, VA 23464 | Full Service B&M | $111,706 |
| Towne Bank | 5216 Monticello Avenue Williamsburg, VA 23188 | Full Service B&M | $309,430 |
| Towne Bank | 550 Settlers Landing Road Hampton, VA 23669 | Full Service B&M | $146,992 |
| Towne Bank | 5716 High Street Portsmouth, VA 23703 | Full Service B&M | $547,296 |
| Towne Bank | 5806 Harbour View Boulevard Suffolk, VA 23435 | Full Service B&M | $298,566 |
| Towne Bank | 600 22nd Street, Ste 100 Virginia Beach, VA 23451 | Full Service B&M | $830,032 |
| Towne Bank | 6001 Harbour View Boulevard Suffolk, VA 23435 | Limited, Administrative | $0 |
| Towne Bank | 6201 Portsmouth Boulevard Portsmouth, VA 23701 | Full Service B&M | $199,173 |
| Towne Bank | 6337 Morrison Boulevard Charlotte, NC 28210 | Full Service B&M | $743,073 |
| Towne Bank | 6515 George Washington Memorial Highway Yorktown, VA 23692 | Full Service B&M | $88,972 |
| Towne Bank | 6670 Caratoke Highway Grandy, NC 27939 | Full Service B&M | $31,545 |
| Towne Bank | 7013 Three Chopt Road Richmond, VA 23226 | Full Service B&M | $186,935 |
| Towne Bank | 7279 Bell Creek Road, South Mechanicsville, VA 23111 | Full Service B&M | $126,566 |
| Towne Bank | 7500 Granby Street Norfolk, VA 23505 | Full Service B&M | $65,821 |
| Towne Bank | 802 Green Valley Rd. Greensboro, NC 27408 | Full Service B&M | $124,484 |
| Towne Bank | 824 Ocean Trail Corolla, NC 27927 | Limited, Drive-thru | $1,617 |
| Towne Bank | 984 First Colonial Road Virginia Beach, VA 23454 | Full Service B&M | $611,253 |
For 2020, Towne Bank had 44 branches.
Yearly Performance Overview
Bank Income
| Item | Value (in 000's) |
|---|---|
| Total interest income | $460,416 |
| Net interest income | $380,401 |
| Total noninterest income | $404,544 |
| Gross Fiduciary activities income | $0 |
| Service charges on deposit accounts | $7,939 |
| Trading account gains and fees | $0 |
| Additional Noninterest Income | $396,605 |
| Pre-tax net operating income | $191,698 |
| Securities gains (or losses, -) | $9,634 |
| Income before extraordinary items | $169,432 |
| Discontinued Operations (Extraordinary gains, net) | $0 |
| Net income of bank and minority interests | $169,432 |
| Minority interest net income | $23,898 |
| Net income | $145,534 |
| Sale, conversion, retirement of capital stock, net | $5,509 |
| Net operating income | $161,339 |
Towne Bank's gross interest income from loans was $460,416,000.
Towne Bank's net interest income from loans was $380,401,000.
Towne Bank's fee based income from loans was $7,939,000.
Towne Bank's net income from loans was $145,534,000.
Bank Expenses
| Item | Value (in 000's) |
|---|---|
| Total interest expense | $80,015 |
| Provision for credit losses | $62,084 |
| Total noninterest expense | $531,163 |
| Salaries and employee benefits | $382,231 |
| Premises and equipment expense | $45,231 |
| Additional noninterest expense | $103,701 |
| Applicable income taxes | $31,900 |
| Net charge-offs | $238 |
| Cash dividends | $52,302 |
Towne Bank's interest expense for loans was $80,015,000.
Towne Bank's payroll and benefits expense were $382,231,000.
Towne Bank's property, plant and equipment expenses $45,231,000.
Loan Performance
| Type of Loan | % of Loans Noncurrent (30+ days, end of period snapshot) |
|---|---|
| All loans | 0.0% |
| Real Estate loans | 0.0% |
| Construction & Land Development loans | 0.0% |
| Nonfarm, nonresidential loans | 0.0% |
| Multifamily residential loans | 0.0% |
| 1-4 family residential loans | 0.0% |
| HELOC loans | 0.0% |
| All other family | 0.0% |
| Commercial & industrial loans | 0.0% |
| Personal loans | 0.0% |
| Credit card loans | 0.0% |
| Other individual loans | 0.0% |
| Auto loans | 0.0% |
| Other consumer loans | 0.0% |
| Unsecured commercial real estate loans | 0.0% |
Deposits
| Type | Value (in 000's) |
|---|---|
| Total deposits | $11,630,263 |
| Deposits held in domestic offices | $11,630,263 |
| Deposits by Individuals, partnerships, and corporations | $10,963,657 |
| Deposits by U.S. Government | $6 |
| Deposits by States and political subdivisions in the U.S. | $660,167 |
| Deposits by Commercial banks and other depository institutions in U.S. | $6,433 |
| Deposits by Banks in foreign countries | $0 |
| Deposits by Foreign governments and official institutions | $0 |
| Transaction accounts | $1,129,203 |
| Demand deposits | $1,129,203 |
| Nontransaction accounts | $10,501,060 |
| Money market deposit accounts (MMDAs) | $8,122,064 |
| Other savings deposits (excluding MMDAs) | $652,205 |
| Total time deposits | $1,726,791 |
| Total time and savings deposits | $10,501,060 |
| Noninterest-bearing deposits | $4,431,664 |
| Interest-bearing deposits | $7,198,600 |
| Retail deposits | $10,657,251 |
| IRAs and Keogh plan accounts | $206,929 |
| Brokered deposits | $397,619 |
| Deposits held in foreign offices | $0 |
Assets
| Asset | Value (in 000's) |
|---|---|
| Total Assets | $14,626,444 |
| Cash & Balances due from depository institutions | $1,864,289 |
| Interest-bearing balances | $1,768,554 |
| Total securities | $1,384,638 |
| Federal funds sold & reverse repurchase | $0 |
| Net loans and leases | $10,049,709 |
| Loan and leases loss allowance | $120,157 |
| Trading account assets | $0 |
| Bank premises and fixed assets | $320,582 |
| Other real estate owned | $4,853 |
| Goodwill and other intangibles | $497,861 |
| All other assets | $504,512 |
Liabilities
| Liabilities | Value (in 000's) |
|---|---|
| Total liabilities and capital | $14,626,444 |
| Total Liabilities | $12,842,614 |
| Total deposits | $11,630,263 |
| Interest-bearing deposits | $7,198,600 |
| Deposits held in domestic offices | $11,630,263 |
| % insured (estimated) | $48 |
| Federal funds purchased and repurchase agreements | $68,981 |
| Trading liabilities | $0 |
| Other borrowed funds | $637,694 |
| Subordinated debt | $249,055 |
| All other liabilities | $256,621 |
Issued Loan Types
| Type | Value (in 000's) |
|---|---|
| Net loans and leases | $10,049,709 |
| Loan and leases loss allowance | $120,157 |
| Total loans and leases (domestic) | $10,169,866 |
| All real estate loans | $7,380,914 |
| Real estate loans in domestic offices | $7,380,914 |
| Construction and development loans | $1,199,772 |
| Residential 1-4 family construction | $270,312 |
| Other construction, all land development and other land | $929,460 |
| Loans secured by nonfarm nonresidential properties | $3,697,169 |
| Nonfarm nonresidential secured by owner-occupied properties | $1,380,516 |
| Commercial real estate & other non-farm, non-residential | $2,316,653 |
| Multifamily residential real estate | $295,488 |
| 1-4 family residential loans | $2,169,902 |
| Farmland loans | $18,583 |
| Loans held in foreign offices | $0 |
| Farm loans | $449 |
| Commercial and industrial loans | $2,009,199 |
| To non-U.S. addressees | $0 |
| Loans to individuals | $309,916 |
| Credit card loans | $0 |
| Related Plans | $33,278 |
| Consumer Auto Loans | $252,088 |
| Other loans to individuals | $24,550 |
| All other loans & leases | $469,387 |
| Loans to foreign governments and official institutions | $0 |
| Other loans | $90,144 |
| Loans to depository institutions and acceptances of other banks | $0 |
| Loans not secured by real estate | $191,789 |
| Loans secured by real estate to non-U.S. addressees | $0 |
| Restructured Loans & leases | $13,404 |
| Non 1-4 family restructured loans & leases | $9,850 |
| Total loans and leases (foreign) | $0 |
Towne Bank had $10,049,709,000 of loans outstanding in 2020. $7,380,914,000 of loans were in real estate loans. $1,199,772,000 of loans were in development loans. $295,488,000 of loans were in multifamily mortgage loans. $2,169,902,000 of loans were in 1-4 family mortgage loans. $449,000 of loans were in farm loans. $0 of loans were in credit card loans. $252,088,000 of loans were in the auto loan category.
Small Business Loans
| Categorization | # of Loans in Category | $ amount of loans (in 000's) | Average $/loan |
|---|---|---|---|
| Nonfarm, nonresidential loans - <$1MM | 2,200 | $682,688 | $310,313 |
| Nonfarm, nonresidential loans - <$100k | 263 | $19,936 | $75,802 |
| Nonfarm, nonresidential loans - $100-250k | 554 | $68,621 | $123,865 |
| Nonfarm, nonresidential loans - $250k-1MM | 1,383 | $594,131 | $429,596 |
| Commercial & Industrial, US addressed loans - <$1MM | 11,348 | $917,754 | $80,874 |
| Commercial & Industrial, US addressed loans - <$100k | 7,888 | $219,650 | $27,846 |
| Commercial & Industrial, US addressed loans - $100-250k | 1,901 | $211,416 | $111,213 |
| Commercial & Industrial, US addressed loans - $250k-1MM | 1,559 | $486,688 | $312,180 |
| Farmland loans - <$1MM | 33 | $4,205 | $127,424 |
| Farmland loans - <$100k | 9 | $347 | $38,556 |
| Farmland loans - $100-250k | 12 | $1,237 | $103,083 |
| Farmland loans - $250k-1MM | 12 | $2,621 | $218,417 |
| Agriculture operations loans - <$1MM | 4 | $448 | $112,000 |
| Agriculture operations loans - <$100k | 1 | $30 | $30,000 |
| Agriculture operations loans - $100-250k | 3 | $418 | $139,333 |