Presidential Bank Fsb Mortgage Rates, Fees & Info
Bethesda, MDLEI: 54930078TNN7GKZ7NU89
Tax ID: 52-1377663
Latest/2024 | 2023 Data | 2022 Data | 2021 Data | 2020 Data | 2019 Data | 2018 Data
Jump to:
Mortgage Data
Bank Data
Review & Overview
Presidential Bank Fsb is a small bank specializing in Refi and Home Purchase loans. Presidential Bank Fsb has a high proportion of conventional loans. They have a a low proportion of FHA loans. (This may mean they shy away from first time homebuyers.) They have a low ratio of USDA loans. Their top markets by origination volume include: Washington, Baltimore, Richmond, Philadelphia, and California among others. We have data for 149 markets. (Some data included below & more in-depth data is available with an active subscription.)Presidential Bank Fsb has an above average approval rate when compared to the average across all lenders. They have an above average pick rate when compared to similar lenders. Presidential Bank Fsb is typically a low fee lender. (We use the term "fees" to include things like closing costs and other costs incurred by borrowers-- whether they are paid out of pocket or rolled into the loan.) They typically have about average rates.
We show data for every lender and do not change our ratings-- even if an organization is a paid advertiser. Our consensus data does have lag, but it is highly correlated to a lender's rates & fees relative to their markets. This means that if a bank is a low fee/rate lender the past-- chances are they are still one today. Our SimulatedRates™ use advanced statistical techniques to forecast different rates based on a lender's historical data.
Mortgage seekers: Choose your metro area here to explore the lowest fee & rate lenders.
Mortgage professionals: We have various tools to make your lives easier. Contact us to see how we can help with your market research, analytics or advertising needs.
SimulatedRates™Mortgage Type |
Simulated Rate | Simulation Date |
|---|---|---|
| 30 Year Conventional Purchase | 7.11% | 7/19/25 |
| 30 Year Conventional Refi | 6.97% | 7/19/25 |
| 30 Year Cash-out Refi | 7.21% | 7/19/25 |
| 30 Year FHA Purchase | 7.35% | 7/19/25 |
| 30 Year FHA Refi | 6.97% | 7/19/25 |
| 30 Year VA Purchase | 6.54% | 7/19/25 |
| 30 Year VA Refi | 6.10% | 7/19/25 |
| 30 Year USDA Purchase | 6.87% | 7/19/25 |
| 30 Year USDA Refi | 6.93% | 7/19/25 |
| 15 Year Conventional Purchase | 6.06% | 7/19/25 |
| 15 Year Conventional Refi | 6.15% | 7/19/25 |
| 15 Year Cash-out Refi | 6.15% | 7/19/25 |
| These are simulated rates generated by our proprietary machine learning models. These are not guaranteed by the bank. They are our estimates based on a lender's past behaviors combined with current market conditions. Contact an individual lender for their actual rates. Our models use fixed rate terms for conforming loans, 700+ FICO, 10% down for FHA and 20% for conventional. These are based on consensus, historical data-- not advertised promotional rates. | ||
Presidential Bank Fsb Mortgage Calculator
Your Estimates
Estimated Loan Payment: Update the calculator values and click calculate payment!
This is not an official calculator from Presidential Bank Fsb. It uses our SimulatedRate™
technology, basic math and reasonable assumptions to calculate mortgage payments derived from our simulations and your inputs.
The default purchase price is the median sales price across the US for 2022Q4, per FRED.
Originations
5,942Origination Dollar Volume (All Markets)
$2,033,090,000Employee count
289Awards


Presidential Bank FSB - 2020
Presidential Bank FSB is a 2020 , due to their low .
For 2020, less than of lenders were eligible for this award.
Work for Presidential Bank FSB?
Use this award on your own site. Either save and use the images below, or pass the provided image embed code to your development team.
Top Markets
Zoom/scroll map to see bank's per metro statistics. Subscribers can configure state/metro/county granularity, assorted fields and quantity of results. This map shows top 10 markets in the map viewport, as defined by descending origination volume.
| Market | Originations | Total Value | Average Loan | Average Fees | Average Rate |
|---|---|---|---|---|---|
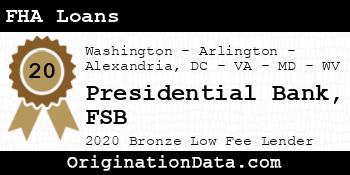
| Washington-Arlington-Alexandria, DC-VA-MD-WV (FHA|USDA|VA) | 2,437 | $956,815,000 | $392,620 | $5,571 | 3.18% |
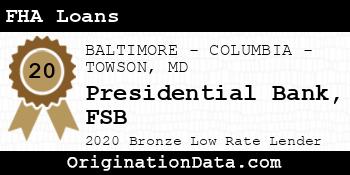
| BALTIMORE-COLUMBIA-TOWSON, MD (FHA|USDA|VA) | 980 | $350,540,000 | $357,694 | $5,068 | 3.10% |
| RICHMOND, VA (FHA|USDA|VA) | 710 | $154,070,000 | $217,000 | $4,958 | 3.26% |
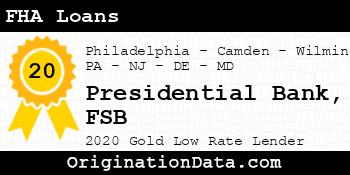
| Philadelphia-Camden-Wilmington, PA-NJ-DE-MD (FHA|USDA|VA) | 447 | $132,605,000 | $296,655 | $5,709 | 3.16% |
| CALIFORNIA-LEXINGTON PARK, MD (FHA|USDA|VA) | 183 | $62,375,000 | $340,847 | $6,432 | 3.24% |
| CHARLOTTESVILLE, VA (FHA|USDA|VA) | 167 | $59,305,000 | $355,120 | $4,914 | 3.25% |
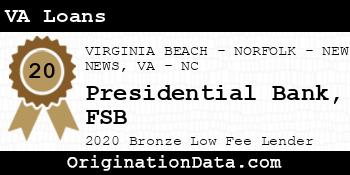
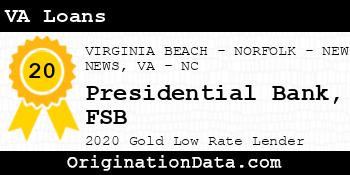
| VIRGINIA BEACH-NORFOLK-NEWPORT NEWS, VA-NC (FHA|USDA|VA) | 91 | $31,175,000 | $342,582 | $4,314 | 2.82% |
| New York-Newark-Jersey City, NY-NJ-PA (FHA|USDA|VA) | 84 | $28,060,000 | $334,048 | $5,589 | 3.14% |
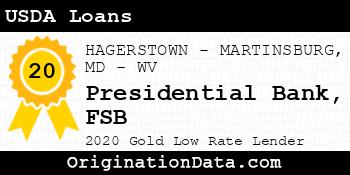
| HAGERSTOWN-MARTINSBURG, MD-WV (FHA|USDA|VA) | 102 | $24,210,000 | $237,353 | $5,411 | 3.21% |
| CHARLOTTE-CONCORD-GASTONIA, NC-SC (FHA|USDA|VA) | 68 | $20,640,000 | $303,529 | $4,386 | 3.26% |
| Outside of Metro Areas | 87 | $20,065,000 | $230,632 | $5,303 | 3.18% |
| SALISBURY, MD-DE (FHA|USDA|VA) | 57 | $18,055,000 | $316,754 | $4,517 | 3.23% |
| OCEAN CITY, NJ (FHA|USDA|VA) | 30 | $13,450,000 | $448,333 | $5,871 | 3.12% |
| SAN DIEGO-CHULA VISTA-CARLSBAD, CA (FHA|USDA|VA) | 14 | $6,780,000 | $484,286 | $4,262 | 2.91% |
| DOVER, DE (FHA|USDA|VA) | 22 | $5,830,000 | $265,000 | $3,551 | 2.62% |
| WINCHESTER, VA-WV (FHA|USDA|VA) | 20 | $5,040,000 | $252,000 | $6,228 | 3.19% |
| URBAN HONOLULU, HI (FHA|USDA|VA) | 7 | $4,745,000 | $677,857 | $5,669 | 2.66% |
| Boston-Cambridge-Newton, MA-NH (FHA|USDA|VA) | 10 | $4,590,000 | $459,000 | $5,314 | 3.21% |
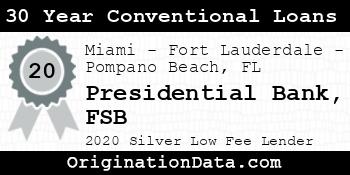
| Miami-Fort Lauderdale-Pompano Beach, FL (FHA|USDA|VA) | 14 | $4,430,000 | $316,429 | $3,769 | 3.04% |
| TAMPA-ST. PETERSBURG-CLEARWATER, FL (FHA|USDA|VA) | 12 | $4,070,000 | $339,167 | $4,392 | 3.18% |
| ALLENTOWN-BETHLEHEM-EASTON, PA-NJ (FHA|USDA|VA) | 16 | $3,980,000 | $248,750 | $6,078 | 3.01% |
| CHARLESTON-NORTH CHARLESTON, SC (FHA|USDA|VA) | 9 | $3,945,000 | $438,333 | $7,021 | 3.04% |
| READING, PA (FHA|USDA|VA) | 18 | $3,550,000 | $197,222 | $6,191 | 2.89% |
| PORTLAND-VANCOUVER-HILLSBORO, OR-WA (FHA|USDA|VA) | 9 | $3,525,000 | $391,667 | $5,189 | 2.94% |
| JACKSONVILLE, FL (FHA|USDA|VA) | 8 | $3,520,000 | $440,000 | $7,972 | 3.19% |
| Los Angeles-Long Beach-Anaheim, CA (FHA|USDA|VA) | 5 | $3,285,000 | $657,000 | $4,678 | 2.68% |
| HILTON HEAD ISLAND-BLUFFTON, SC (FHA|USDA|VA) | 8 | $3,160,000 | $395,000 | $5,396 | 3.12% |
| Easton, MD (FHA|USDA|VA) | 8 | $3,070,000 | $383,750 | $4,463 | 3.08% |
| DENVER-AURORA-LAKEWOOD, CO (FHA|USDA|VA) | 8 | $3,010,000 | $376,250 | $3,822 | 2.98% |
| CHAMBERSBURG-WAYNESBORO, PA (FHA|USDA|VA) | 14 | $2,840,000 | $202,857 | $7,637 | 3.23% |
| RALEIGH-CARY, NC (FHA|USDA|VA) | 10 | $2,730,000 | $273,000 | $4,372 | 3.25% |
| MYRTLE BEACH-CONWAY-NORTH MYRTLE BEACH, SC-NC (FHA|USDA|VA) | 9 | $2,535,000 | $281,667 | $6,007 | 3.06% |
| PROVIDENCE-WARWICK, RI-MA (FHA|USDA|VA) | 7 | $2,475,000 | $353,571 | $3,341 | 3.07% |
| North Port-Sarasota-Bradenton, FL (FHA|USDA|VA) | 7 | $2,425,000 | $346,429 | $4,688 | 2.84% |
| MOUNT VERNON-ANACORTES, WA (FHA|USDA|VA) | 5 | $2,395,000 | $479,000 | $7,462 | 3.05% |
| Chicago-Naperville-Elgin, IL-IN-WI (FHA|USDA|VA) | 3 | $2,345,000 | $781,667 | $6,819 | 2.67% |
| GETTYSBURG, PA (FHA|USDA|VA) | 10 | $2,330,000 | $233,000 | $5,326 | 3.06% |
| HOUSTON-THE WOODLANDS-SUGAR LAND, TX (FHA|USDA|VA) | 6 | $2,050,000 | $341,667 | $4,950 | 2.96% |
| Kill Devil Hills, NC (FHA|USDA|VA) | 6 | $1,940,000 | $323,333 | $4,571 | 3.31% |
| PHOENIX-MESA-CHANDLER, AZ (FHA|USDA|VA) | 5 | $1,735,000 | $347,000 | $4,431 | 3.05% |
| ATLANTIC CITY-HAMMONTON, NJ (FHA|USDA|VA) | 8 | $1,700,000 | $212,500 | $4,574 | 3.17% |
| DELTONA-DAYTONA BEACH-ORMOND BEACH, FL (FHA|USDA|VA) | 6 | $1,700,000 | $283,333 | $5,479 | 3.12% |
| DURHAM-CHAPEL HILL, NC (FHA|USDA|VA) | 5 | $1,655,000 | $331,000 | $2,677 | 2.70% |
| CRESTVIEW-FORT WALTON BEACH-DESTIN, FL (FHA|USDA|VA) | 5 | $1,625,000 | $325,000 | $5,399 | 2.88% |
| FAYETTEVILLE, NC (FHA|USDA|VA) | 6 | $1,580,000 | $263,333 | $4,895 | 2.90% |
| Seattle-Tacoma-Bellevue, WA (FHA|USDA|VA) | 3 | $1,555,000 | $518,333 | $4,430 | 2.75% |
| YORK-HANOVER, PA (FHA|USDA|VA) | 5 | $1,545,000 | $309,000 | $4,320 | 3.15% |
| ORLANDO-KISSIMMEE-SANFORD, FL (FHA|USDA|VA) | 6 | $1,510,000 | $251,667 | $3,355 | 3.04% |
| Pinehurst-Southern Pines, NC (FHA|USDA|VA) | 5 | $1,485,000 | $297,000 | $4,732 | 3.18% |
| LYNCHBURG, VA (FHA|USDA|VA) | 4 | $1,480,000 | $370,000 | $3,865 | 3.31% |
| WILMINGTON, NC (FHA|USDA|VA) | 4 | $1,400,000 | $350,000 | $6,172 | 3.19% |
| BOULDER, CO (FHA|USDA|VA) | 2 | $1,370,000 | $685,000 | $3,519 | 3.31% |
| PORT ST. LUCIE, FL (FHA|USDA|VA) | 4 | $1,360,000 | $340,000 | $4,767 | 2.56% |
| NAPLES-MARCO ISLAND, FL (FHA|USDA|VA) | 3 | $1,355,000 | $451,667 | $6,571 | 3.08% |
| ROANOKE, VA (FHA|USDA|VA) | 4 | $1,290,000 | $322,500 | $4,129 | 3.09% |
| Detroit-Warren-Dearborn, MI (FHA|USDA|VA) | 3 | $1,255,000 | $418,333 | $2,940 | 2.83% |
| ATLANTA-SANDY SPRINGS-ALPHARETTA, GA (FHA|USDA|VA) | 4 | $1,220,000 | $305,000 | $3,442 | 2.88% |
| NASHVILLE-DAVIDSON-MURFREESBORO-FRANKLIN, TN (FHA|USDA|VA) | 3 | $1,215,000 | $405,000 | $2,289 | 2.54% |
| PENSACOLA-FERRY PASS-BRENT, FL (FHA|USDA|VA) | 5 | $1,205,000 | $241,000 | $3,284 | 3.10% |
| COLUMBIA, SC (FHA|USDA|VA) | 6 | $1,170,000 | $195,000 | $4,369 | 3.08% |
| Concord, NH (FHA|USDA|VA) | 3 | $1,145,000 | $381,667 | $2,826 | 2.83% |
| PORTLAND-SOUTH PORTLAND, ME (FHA|USDA|VA) | 3 | $1,045,000 | $348,333 | $4,383 | 3.04% |
| MINNEAPOLIS-ST. PAUL-BLOOMINGTON, MN-WI (FHA|USDA|VA) | 4 | $1,020,000 | $255,000 | $2,929 | 3.19% |
| SCRANTON--WILKES-BARRE, PA (FHA|USDA|VA) | 4 | $1,020,000 | $255,000 | $4,932 | 3.00% |
| MEMPHIS, TN-MS-AR (FHA|USDA|VA) | 3 | $975,000 | $325,000 | $3,517 | 2.67% |
| BURLINGTON-SOUTH BURLINGTON, VT (FHA|USDA|VA) | 2 | $920,000 | $460,000 | $4,773 | 2.44% |
| KANSAS CITY, MO-KS (FHA|USDA|VA) | 2 | $910,000 | $455,000 | $5,886 | 2.69% |
| HARRISBURG-CARLISLE, PA (FHA|USDA|VA) | 4 | $890,000 | $222,500 | $6,364 | 3.19% |
| BOISE CITY, ID (FHA|USDA|VA) | 2 | $890,000 | $445,000 | $2,612 | 2.63% |
| MORGANTOWN, WV (FHA|USDA|VA) | 3 | $875,000 | $291,667 | $3,412 | 3.71% |
| PANAMA CITY, FL (FHA|USDA|VA) | 3 | $855,000 | $285,000 | $3,913 | 2.79% |
| CINCINNATI, OH-KY-IN (FHA|USDA|VA) | 3 | $845,000 | $281,667 | $5,339 | 3.21% |
| COLUMBUS, OH (FHA|USDA|VA) | 3 | $835,000 | $278,333 | $4,414 | 3.00% |
| PITTSBURGH, PA (FHA|USDA|VA) | 3 | $805,000 | $268,333 | $3,090 | 3.21% |
| Keene, NH (FHA|USDA|VA) | 2 | $790,000 | $395,000 | $2,587 | 3.06% |
| GREENSBORO-HIGH POINT, NC (FHA|USDA|VA) | 2 | $770,000 | $385,000 | $5,114 | 3.12% |
| KNOXVILLE, TN (FHA|USDA|VA) | 2 | $750,000 | $375,000 | $3,389 | 3.13% |
| MILWAUKEE-WAUKESHA, WI (FHA|USDA|VA) | 2 | $750,000 | $375,000 | $11,951 | 2.75% |
| AUSTIN-ROUND ROCK-GEORGETOWN, TX (FHA|USDA|VA) | 2 | $720,000 | $360,000 | $3,437 | 2.87% |
| BARNSTABLE TOWN, MA (FHA|USDA|VA) | 2 | $720,000 | $360,000 | $3,215 | 3.31% |
| LANCASTER, PA (FHA|USDA|VA) | 1 | $705,000 | $705,000 | $22,421 | 3.38% |
| THE VILLAGES, FL (FHA|USDA|VA) | 2 | $690,000 | $345,000 | $3,689 | 3.56% |
| CAPE CORAL-FORT MYERS, FL (FHA|USDA|VA) | 3 | $675,000 | $225,000 | $3,304 | 2.88% |
| GREENVILLE, NC (FHA|USDA|VA) | 2 | $640,000 | $320,000 | $7,262 | 3.31% |
| Key West, FL (FHA|USDA|VA) | 2 | $620,000 | $310,000 | $3,425 | 2.75% |
| Dallas-Fort Worth-Arlington, TX (FHA|USDA|VA) | 1 | $595,000 | $595,000 | $3,125 | 2.75% |
| HICKORY-LENOIR-MORGANTON, NC (FHA|USDA|VA) | 2 | $590,000 | $295,000 | $3,409 | 3.00% |
| SYRACUSE, NY (FHA|USDA|VA) | 2 | $580,000 | $290,000 | $7,437 | 3.44% |
| STAUNTON, VA (FHA|USDA|VA) | 2 | $570,000 | $285,000 | $5,851 | 3.75% |
| PALM BAY-MELBOURNE-TITUSVILLE, FL (FHA|USDA|VA) | 2 | $570,000 | $285,000 | $5,475 | 3.13% |
| VALDOSTA, GA (FHA|USDA|VA) | 2 | $560,000 | $280,000 | $5,571 | 2.75% |
| BLACKSBURG-CHRISTIANSBURG, VA (FHA|USDA|VA) | 3 | $545,000 | $181,667 | $3,174 | 3.58% |
| HUNTSVILLE, AL (FHA|USDA|VA) | 2 | $520,000 | $260,000 | $5,666 | 2.44% |
| TRENTON-PRINCETON, NJ (FHA|USDA|VA) | 1 | $515,000 | $515,000 | $10,490 | 3.38% |
| Morehead City, NC (FHA|USDA|VA) | 1 | $515,000 | $515,000 | $5,906 | 2.88% |
| St. Marys, GA (FHA|USDA|VA) | 2 | $510,000 | $255,000 | $1,807 | 2.75% |
| SALINAS, CA (FHA|USDA|VA) | 1 | $485,000 | $485,000 | $0 | 2.75% |
| San Francisco-Oakland-Berkeley, CA (FHA|USDA|VA) | 1 | $445,000 | $445,000 | $1,507 | 2.25% |
| INDIANAPOLIS-CARMEL-ANDERSON, IN (FHA|USDA|VA) | 1 | $415,000 | $415,000 | $2,468 | 3.38% |
| SPRINGFIELD, MA (FHA|USDA|VA) | 1 | $385,000 | $385,000 | $12,939 | 2.75% |
| OLYMPIA-LACEY-TUMWATER, WA (FHA|USDA|VA) | 1 | $375,000 | $375,000 | $1,537 | 2.63% |
| GULFPORT-BILOXI, MS (FHA|USDA|VA) | 1 | $365,000 | $365,000 | $3,937 | 3.50% |
| Oak Harbor, WA (FHA|USDA|VA) | 1 | $345,000 | $345,000 | $0 | 2.25% |
| JACKSON, MS (FHA|USDA|VA) | 1 | $345,000 | $345,000 | $8,748 | 2.38% |
| LAKELAND-WINTER HAVEN, FL (FHA|USDA|VA) | 1 | $335,000 | $335,000 | $3,382 | 2.75% |
| SACRAMENTO-ROSEVILLE-FOLSOM, CA (FHA|USDA|VA) | 1 | $325,000 | $325,000 | $0 | 2.75% |
| NEW HAVEN-MILFORD, CT (FHA|USDA|VA) | 1 | $325,000 | $325,000 | $2,772 | 2.50% |
| KENNEWICK-RICHLAND, WA (FHA|USDA|VA) | 1 | $315,000 | $315,000 | $2,654 | 2.88% |
| Sayre, PA (FHA|USDA|VA) | 1 | $305,000 | $305,000 | $4,346 | 3.38% |
| WARNER ROBINS, GA (FHA|USDA|VA) | 1 | $305,000 | $305,000 | $3,683 | 2.75% |
| POUGHKEEPSIE-NEWBURGH-MIDDLETOWN, NY (FHA|USDA|VA) | 1 | $305,000 | $305,000 | $5,483 | 2.75% |
| BOWLING GREEN, KY (FHA|USDA|VA) | 1 | $295,000 | $295,000 | $8,741 | 2.75% |
| Palatka, FL (FHA|USDA|VA) | 1 | $285,000 | $285,000 | $4,915 | 2.75% |
| GREENVILLE-ANDERSON, SC (FHA|USDA|VA) | 1 | $285,000 | $285,000 | $3,552 | 2.75% |
| HOMOSASSA SPRINGS, FL (FHA|USDA|VA) | 1 | $285,000 | $285,000 | $4,471 | 3.25% |
| SALT LAKE CITY, UT (FHA|USDA|VA) | 1 | $285,000 | $285,000 | $3,312 | 3.00% |
| Danville, VA (FHA|USDA|VA) | 1 | $285,000 | $285,000 | $3,368 | 2.99% |
| TEXARKANA, TX-AR (FHA|USDA|VA) | 1 | $285,000 | $285,000 | $14,313 | 2.88% |
| JACKSONVILLE, NC (FHA|USDA|VA) | 1 | $285,000 | $285,000 | $0 | 4.12% |
| HARRISONBURG, VA (FHA|USDA|VA) | 1 | $275,000 | $275,000 | $3,528 | 3.38% |
| BREMERTON-SILVERDALE-PORT ORCHARD, WA (FHA|USDA|VA) | 1 | $275,000 | $275,000 | $0 | 3.25% |
| NEW BERN, NC (FHA|USDA|VA) | 2 | $270,000 | $135,000 | $2,821 | 3.56% |
| LAS CRUCES, NM (FHA|USDA|VA) | 1 | $255,000 | $255,000 | $2,793 | 2.63% |
| MANCHESTER-NASHUA, NH (FHA|USDA|VA) | 1 | $255,000 | $255,000 | $2,574 | 2.63% |
| OGDEN-CLEARFIELD, UT (FHA|USDA|VA) | 1 | $255,000 | $255,000 | $7,507 | 2.25% |
| CHATTANOOGA, TN-GA (FHA|USDA|VA) | 1 | $245,000 | $245,000 | $2,003 | 2.75% |
| Georgetown, SC (FHA|USDA|VA) | 1 | $245,000 | $245,000 | $3,068 | 2.88% |
| COLORADO SPRINGS, CO (FHA|USDA|VA) | 1 | $235,000 | $235,000 | $2,684 | 2.25% |
| SANTA FE, NM (FHA|USDA|VA) | 1 | $235,000 | $235,000 | $4,352 | 3.25% |
| ALBANY-SCHENECTADY-TROY, NY (FHA|USDA|VA) | 1 | $225,000 | $225,000 | $3,684 | 2.99% |
| COLUMBUS, GA-AL (FHA|USDA|VA) | 1 | $225,000 | $225,000 | $11,040 | 2.88% |
| SAVANNAH, GA (FHA|USDA|VA) | 1 | $225,000 | $225,000 | $4,148 | 3.38% |
| VINELAND-BRIDGETON, NJ (FHA|USDA|VA) | 1 | $225,000 | $225,000 | $10,916 | 2.75% |
| Lebanon, NH-VT (FHA|USDA|VA) | 1 | $215,000 | $215,000 | $6,045 | 3.00% |
| Mountain Home, ID (FHA|USDA|VA) | 1 | $205,000 | $205,000 | $9,129 | 2.50% |
| KILLEEN-TEMPLE, TX (FHA|USDA|VA) | 1 | $205,000 | $205,000 | $3,181 | 2.75% |
| CLARKSVILLE, TN-KY (FHA|USDA|VA) | 1 | $195,000 | $195,000 | $3,234 | 3.25% |
| NORWICH-NEW LONDON, CT (FHA|USDA|VA) | 1 | $195,000 | $195,000 | $3,857 | 2.95% |
| SAN ANTONIO-NEW BRAUNFELS, TX (FHA|USDA|VA) | 1 | $185,000 | $185,000 | $0 | 3.25% |
| ALTOONA, PA (FHA|USDA|VA) | 1 | $185,000 | $185,000 | $6,708 | 3.75% |
| Pottsville, PA (FHA|USDA|VA) | 1 | $175,000 | $175,000 | $3,728 | 3.13% |
| BELLINGHAM, WA (FHA|USDA|VA) | 1 | $165,000 | $165,000 | $3,371 | 3.88% |
| Sebastian-Vero Beach, FL (FHA|USDA|VA) | 1 | $165,000 | $165,000 | $5,237 | 4.12% |
| OCALA, FL (FHA|USDA|VA) | 1 | $165,000 | $165,000 | $4,202 | 3.38% |
| EAST STROUDSBURG, PA (FHA|USDA|VA) | 1 | $155,000 | $155,000 | $3,532 | 3.25% |
| TUCSON, AZ (FHA|USDA|VA) | 1 | $135,000 | $135,000 | $0 | 2.75% |
| Clovis, NM (FHA|USDA|VA) | 1 | $135,000 | $135,000 | $2,035 | 2.75% |
| Henderson, NC (FHA|USDA|VA) | 1 | $105,000 | $105,000 | $3,428 | 2.50% |
| AKRON, OH (FHA|USDA|VA) | 1 | $95,000 | $95,000 | $0 | 4.75% |
Similar Lenders
We use machine learning to identify the top lenders compared against Presidential Bank FSB based on their rates and fees, along with other useful metrics. A lower similarity rank signals a stronger match.
Similarity Rank: 90
Similarity Rank: 134
Similarity Rank: 247
Similarity Rank: 289
Similarity Rank: 304
Similarity Rank: 482
Similarity Rank: 496
Similarity Rank: 538
Similarity Rank: 589
Similarity Rank: 625
Product Mix
For 2020, Presidential Bank Fsb's most frequently originated type of loan was Conventional, with 4,495 originations. Their 2nd most popular type was VA, with 950 originations.
Loan Reason
For 2020, Presidential Bank Fsb's most frequently cited loan purpose was Refi, with 2,720 originations. The 2nd most popular reason was Home Purchase, with 2,649 originations.
Loan Duration/Length
For 2020, Presidential Bank Fsb's most frequently cited loan duration was 30 Year, with 5,293 originations. The 2nd most popular length was 15 Year, with 388 originations.
Origination Fees/Closing Costs
Presidential Bank Fsb's average total fees were $5,515, while their most frequently occuring range of origination fees (closing costs) were in the $1k-2k bucket, with 3,992 originations.
Interest Rates
During 2020, Presidential Bank Fsb's average interest rate for loans was 3.19%, while their most frequently originated rate bucket for loans was 3-4%, with 2,913 originations.
Loan Sizing
2020 saw Presidential Bank Fsb place emphasis on $200k-400k loans with 3,022 originations, totaling $893,940,000 in origination value.
Applicant Income
Presidential Bank Fsb lent most frequently to those with incomes in the $100k-150k range, with 1,326 originations. The second most popular income band? $150k-250k, with 1,296 originations.
Applicant Debt to Income Ratio
Presidential Bank Fsb lent most frequently to those with DTI ratios of 20-30%, with 1,515 originations. The next most common DTI ratio? 30-36%, with 1,053 originations.
Ethnicity Mix
Approval Rates
Total approvals of all applications98.07%
Presidential Bank Fsb has an exceptionally high approval rate. They either target their audience very well or may have lax underwriting protocols.
Pick Rate
Approvals leading to origination90.88%
Presidential Bank Fsb has an average pick rate.
Points and Fees
| Points | Originations | Total Value | Average Loan |
|---|---|---|---|
| NA | 5,942 | $2,033,090,000 | $342,156 |
Occupancy Type Mix
| Dwelling Type | Originations | Total Value | Average Loan |
|---|---|---|---|
| Single Family (1-4 Units):Manufactured | 4 | $430,000 | $107,500 |
| Single Family (1-4 Units):Site-Built | 5,938 | $2,032,660,000 | $342,314 |
LTV Distribution
Complaints
| Bank Name | Product | Issue | 2020 CPFB Complaints | % of Total Issues |
|---|---|---|---|---|
| PARKSIDE LENDING, LLC | Conventional home mortgage | Trouble during payment process | 1 | 33.3% |
| PARKSIDE LENDING, LLC | FHA mortgage | Trouble during payment process | 2 | 66.7% |
Bank Details
Branches
| Bank Name | Branch | Branch Type | Deposits (000's) |
|---|---|---|---|
| Presidential Bank, FSB | 11640 Rockville Pike Rockville, MD 20852 | Full Service B&M | $52,197 |
| Presidential Bank, FSB | 1515 Wilson Boulevard Arlington, VA 22209 | Full Service B&M | $18,063 |
| Presidential Bank, FSB | 1660 K Street Washington, DC 20006 | Full Service B&M | $47,521 |
| Presidential Bank, FSB | 1675 Reston Pkwy Reston, VA 20194 | Full Service Retail | $17,630 |
| Presidential Bank, FSB | 21 Catoctin Cir Se Leesburg, VA 20175 | Full Service B&M | $22,981 |
| Presidential Bank, FSB | 4520 East-West Highway Bethesda, MD 20814 | Full Service B&M | $80,690 |
| Presidential Bank, FSB | 4520 East-West Hwy Bethesda, MD 20814 | Full Service Cyber Office | $300,061 |
| Presidential Bank, FSB | 6707 Old Dominion Drive Mclean, VA 22101 | Full Service B&M | $27,505 |
| Presidential Bank, FSB | 8150 Leesburg Pike, Suite 150 Vienna, VA 22182 | Full Service B&M | $26,612 |
| Presidential Bank, FSB | 901 N. Stuart Street Arlington, VA 22203 | Full Service B&M | $12,813 |
For 2020, Presidential Bank Fsb had 10 branches.
Yearly Performance Overview
Bank Income
| Item | Value (in 000's) |
|---|---|
| Total interest income | $29,583 |
| Net interest income | $24,242 |
| Total noninterest income | $64,731 |
| Gross Fiduciary activities income | $5 |
| Service charges on deposit accounts | $54 |
| Trading account gains and fees | $0 |
| Additional Noninterest Income | $64,672 |
| Pre-tax net operating income | $27,488 |
| Securities gains (or losses, -) | $-6 |
| Income before extraordinary items | $19,966 |
| Discontinued Operations (Extraordinary gains, net) | $0 |
| Net income of bank and minority interests | $19,966 |
| Minority interest net income | $0 |
| Net income | $19,966 |
| Sale, conversion, retirement of capital stock, net | $0 |
| Net operating income | $19,970 |
Presidential Bank Fsb's gross interest income from loans was $29,583,000.
Presidential Bank Fsb's net interest income from loans was $24,242,000.
Presidential Bank Fsb's fee based income from loans was $54,000.
Presidential Bank Fsb's net income from loans was $19,966,000.
Bank Expenses
| Item | Value (in 000's) |
|---|---|
| Total interest expense | $5,341 |
| Provision for credit losses | $3,075 |
| Total noninterest expense | $58,410 |
| Salaries and employee benefits | $45,879 |
| Premises and equipment expense | $4,297 |
| Additional noninterest expense | $8,234 |
| Applicable income taxes | $7,516 |
| Net charge-offs | $539 |
| Cash dividends | $1,400 |
Presidential Bank Fsb's interest expense for loans was $5,341,000.
Presidential Bank Fsb's payroll and benefits expense were $45,879,000.
Presidential Bank Fsb's property, plant and equipment expenses $4,297,000.
Loan Performance
| Type of Loan | % of Loans Noncurrent (30+ days, end of period snapshot) |
|---|---|
| All loans | 0.0% |
| Real Estate loans | 0.0% |
| Construction & Land Development loans | 0.0% |
| Nonfarm, nonresidential loans | 0.0% |
| Multifamily residential loans | 0.0% |
| 1-4 family residential loans | 0.0% |
| HELOC loans | 0.0% |
| All other family | 0.0% |
| Commercial & industrial loans | 0.0% |
| Personal loans | 0.0% |
| Credit card loans | 0.0% |
| Other individual loans | 0.0% |
| Auto loans | 0.0% |
| Other consumer loans | 0.0% |
| Unsecured commercial real estate loans | 0.0% |
Deposits
| Type | Value (in 000's) |
|---|---|
| Total deposits | $715,308 |
| Deposits held in domestic offices | $715,308 |
| Deposits by Individuals, partnerships, and corporations | $714,327 |
| Deposits by U.S. Government | $0 |
| Deposits by States and political subdivisions in the U.S. | $0 |
| Deposits by Commercial banks and other depository institutions in U.S. | $981 |
| Deposits by Banks in foreign countries | $0 |
| Deposits by Foreign governments and official institutions | $0 |
| Transaction accounts | $75,319 |
| Demand deposits | $4,085 |
| Nontransaction accounts | $639,989 |
| Money market deposit accounts (MMDAs) | $410,299 |
| Other savings deposits (excluding MMDAs) | $108,119 |
| Total time deposits | $121,571 |
| Total time and savings deposits | $711,223 |
| Noninterest-bearing deposits | $31,010 |
| Interest-bearing deposits | $684,298 |
| Retail deposits | $683,173 |
| IRAs and Keogh plan accounts | $6,282 |
| Brokered deposits | $0 |
| Deposits held in foreign offices | $0 |
Assets
| Asset | Value (in 000's) |
|---|---|
| Total Assets | $816,519 |
| Cash & Balances due from depository institutions | $122,827 |
| Interest-bearing balances | $120,552 |
| Total securities | $29,335 |
| Federal funds sold & reverse repurchase | $0 |
| Net loans and leases | $627,458 |
| Loan and leases loss allowance | $8,693 |
| Trading account assets | $0 |
| Bank premises and fixed assets | $3,174 |
| Other real estate owned | $0 |
| Goodwill and other intangibles | $0 |
| All other assets | $33,725 |
Liabilities
| Liabilities | Value (in 000's) |
|---|---|
| Total liabilities and capital | $816,519 |
| Total Liabilities | $732,968 |
| Total deposits | $715,308 |
| Interest-bearing deposits | $684,298 |
| Deposits held in domestic offices | $715,308 |
| % insured (estimated) | $82 |
| Federal funds purchased and repurchase agreements | $0 |
| Trading liabilities | $0 |
| Other borrowed funds | $0 |
| Subordinated debt | $0 |
| All other liabilities | $17,660 |
Issued Loan Types
| Type | Value (in 000's) |
|---|---|
| Net loans and leases | $627,458 |
| Loan and leases loss allowance | $8,693 |
| Total loans and leases (domestic) | $636,151 |
| All real estate loans | $556,919 |
| Real estate loans in domestic offices | $556,919 |
| Construction and development loans | $48,854 |
| Residential 1-4 family construction | $29,494 |
| Other construction, all land development and other land | $19,360 |
| Loans secured by nonfarm nonresidential properties | $187,217 |
| Nonfarm nonresidential secured by owner-occupied properties | $5,031 |
| Commercial real estate & other non-farm, non-residential | $182,186 |
| Multifamily residential real estate | $36,067 |
| 1-4 family residential loans | $284,781 |
| Farmland loans | $0 |
| Loans held in foreign offices | $0 |
| Farm loans | $0 |
| Commercial and industrial loans | $42,936 |
| To non-U.S. addressees | $0 |
| Loans to individuals | $28,110 |
| Credit card loans | $0 |
| Related Plans | $77 |
| Consumer Auto Loans | $0 |
| Other loans to individuals | $28,033 |
| All other loans & leases | $8,186 |
| Loans to foreign governments and official institutions | $0 |
| Other loans | $0 |
| Loans to depository institutions and acceptances of other banks | $0 |
| Loans not secured by real estate | $0 |
| Loans secured by real estate to non-U.S. addressees | $0 |
| Restructured Loans & leases | $5,657 |
| Non 1-4 family restructured loans & leases | $4,936 |
| Total loans and leases (foreign) | $0 |
Presidential Bank FSB had $627,458,000 of loans outstanding in 2020. $556,919,000 of loans were in real estate loans. $48,854,000 of loans were in development loans. $36,067,000 of loans were in multifamily mortgage loans. $284,781,000 of loans were in 1-4 family mortgage loans. $0 of loans were in farm loans. $0 of loans were in credit card loans. $0 of loans were in the auto loan category.
Small Business Loans
| Categorization | # of Loans in Category | $ amount of loans (in 000's) | Average $/loan |
|---|---|---|---|
| Nonfarm, nonresidential loans - <$1MM | 51 | $25,196 | $494,039 |
| Nonfarm, nonresidential loans - <$100k | 1 | $49 | $49,000 |
| Nonfarm, nonresidential loans - $100-250k | 5 | $823 | $164,600 |
| Nonfarm, nonresidential loans - $250k-1MM | 45 | $24,324 | $540,533 |
| Commercial & Industrial, US addressed loans - <$1MM | 264 | $28,569 | $108,216 |
| Commercial & Industrial, US addressed loans - <$100k | 182 | $4,154 | $22,824 |
| Commercial & Industrial, US addressed loans - $100-250k | 24 | $3,161 | $131,708 |
| Commercial & Industrial, US addressed loans - $250k-1MM | 58 | $21,254 | $366,448 |