Old National Bank Mortgage Rates, Fees & Info
Evansville, INLEI: 549300AT7EB9FJAF0E61
Tax ID: 35-1729164
Latest/2024 | 2023 Data | 2022 Data | 2021 Data | 2020 Data | 2019 Data | 2018 Data
Jump to:
Mortgage Data
Bank Data
Review & Overview
Old National Bank is a mid-sized bank specializing in Refi and Home Purchase loans. Old National Bank has a high proportion of conventional loans. They have a a low proportion of FHA loans. (This may mean they shy away from first time homebuyers.) They have a low ratio of USDA loans. Their top markets by origination volume include: Minneapolis, Indianapolis, Grand Rapids, Madison, and Milwaukee among others. We have data for 200 markets. (Some data included below & more in-depth data is available with an active subscription.)Old National Bank has an average approval rate when compared to the average across all lenders. They have a below average pick rate when compared to similar lenders. Old National Bank is typically a low fee lender. (We use the term "fees" to include things like closing costs and other costs incurred by borrowers-- whether they are paid out of pocket or rolled into the loan.) They typically have about average rates.
We show data for every lender and do not change our ratings-- even if an organization is a paid advertiser. Our consensus data does have lag, but it is highly correlated to a lender's rates & fees relative to their markets. This means that if a bank is a low fee/rate lender the past-- chances are they are still one today. Our SimulatedRates™ use advanced statistical techniques to forecast different rates based on a lender's historical data.
Mortgage seekers: Choose your metro area here to explore the lowest fee & rate lenders.
Mortgage professionals: We have various tools to make your lives easier. Contact us to see how we can help with your market research, analytics or advertising needs.
SimulatedRates™Mortgage Type |
Simulated Rate | Simulation Date |
|---|---|---|
| Home Equity Line of Credit (HELOC) | 6.72% | 7/24/26 |
| 30 Year Conventional Purchase | 6.62% | 7/24/26 |
| 30 Year Conventional Refi | 6.68% | 7/24/26 |
| 30 Year Cash-out Refi | 7.08% | 7/24/26 |
| 30 Year FHA Purchase | 6.98% | 7/24/26 |
| 30 Year FHA Refi | 6.60% | 7/24/26 |
| 30 Year VA Purchase | 5.97% | 7/24/26 |
| 30 Year VA Refi | 5.87% | 7/24/26 |
| 30 Year USDA Purchase | 6.81% | 7/24/26 |
| 15 Year Conventional Purchase | 6.08% | 7/24/26 |
| 15 Year Conventional Refi | 6.53% | 7/24/26 |
| 15 Year Cash-out Refi | 6.53% | 7/24/26 |
| 15 Year FHA Refi | 6.09% | 7/24/26 |
| These are simulated rates generated by our proprietary machine learning models. These are not guaranteed by the bank. They are our estimates based on a lender's past behaviors combined with current market conditions. Contact an individual lender for their actual rates. Our models use fixed rate terms for conforming loans, 700+ FICO, 10% down for FHA and 20% for conventional. These are based on consensus, historical data-- not advertised promotional rates. | ||
Old National Bank Mortgage Calculator
Your Estimates
Estimated Loan Payment: Update the calculator values and click calculate payment!
This is not an official calculator from Old National Bank. It uses our SimulatedRate™
technology, basic math and reasonable assumptions to calculate mortgage payments derived from our simulations and your inputs.
The default purchase price is the median sales price across the US for 2022Q4, per FRED.
Originations
12,287Origination Dollar Volume (All Markets)
$3,321,585,000Employee count
2,168Awards


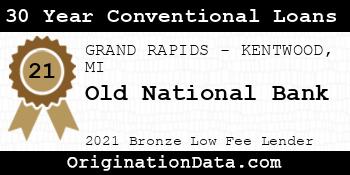


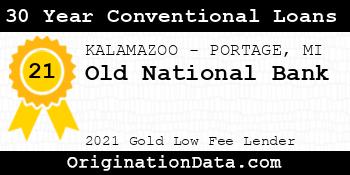
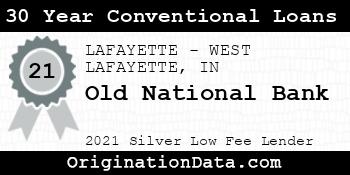


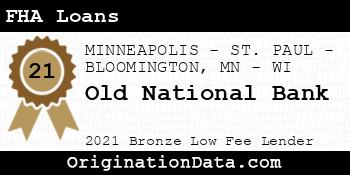


Old National Bank - 2021
Old National Bank is a 2021 , due to their low .
For 2021, less than of lenders were eligible for this award.
Work for Old National Bank?
Use this award on your own site. Either save and use the images below, or pass the provided image embed code to your development team.
Top Markets
Zoom/scroll map to see bank's per metro statistics. Subscribers can configure state/metro/county granularity, assorted fields and quantity of results. This map shows top 10 markets in the map viewport, as defined by descending origination volume.
| Market | Originations | Total Value | Average Loan | Average Fees | Average Rate |
|---|---|---|---|---|---|
| MINNEAPOLIS-ST. PAUL-BLOOMINGTON, MN-WI (FHA|USDA|VA) | 1,478 | $486,620,000 | $329,242 | $3,564 | 2.63% |
| INDIANAPOLIS-CARMEL-ANDERSON, IN (FHA|USDA|VA) | 1,241 | $293,395,000 | $236,418 | $2,043 | 2.67% |
| GRAND RAPIDS-KENTWOOD, MI (FHA|USDA|VA) | 981 | $271,905,000 | $277,171 | $2,715 | 2.79% |
| MADISON, WI (FHA|USDA|VA) | 792 | $248,470,000 | $313,725 | $2,615 | 2.77% |
| MILWAUKEE-WAUKESHA, WI (FHA|USDA|VA) | 405 | $196,185,000 | $484,407 | $2,207 | 2.86% |
| ANN ARBOR, MI (FHA|USDA|VA) | 483 | $169,585,000 | $351,108 | $2,934 | 2.76% |
| EVANSVILLE, IN-KY (FHA|USDA|VA) | 842 | $146,930,000 | $174,501 | $1,993 | 2.81% |
| Outside of Metro Areas | 683 | $108,515,000 | $158,880 | $2,199 | 2.81% |
| LOUISVILLE, KY (FHA|USDA|VA) | 245 | $91,975,000 | $375,408 | $2,936 | 2.76% |
| Detroit-Warren-Dearborn, MI (FHA|USDA|VA) | 219 | $76,365,000 | $348,699 | $2,946 | 2.79% |
| BLOOMINGTON, IN (FHA|USDA|VA) | 354 | $73,470,000 | $207,542 | $1,950 | 2.72% |
| LEXINGTON-FAYETTE, KY (FHA|USDA|VA) | 131 | $53,645,000 | $409,504 | $3,817 | 2.79% |
| GAINESVILLE, FL (FHA|USDA|VA) | 1 | $49,145,000 | $49,145,000 | $0 | 3.36% |
| LAFAYETTE-WEST LAFAYETTE, IN (FHA|USDA|VA) | 308 | $46,900,000 | $152,273 | $1,895 | 2.81% |
| Adrian, MI (FHA|USDA|VA) | 307 | $44,855,000 | $146,107 | $2,340 | 2.94% |
| FORT WAYNE, IN (FHA|USDA|VA) | 205 | $44,665,000 | $217,878 | $2,138 | 2.58% |
| TERRE HAUTE, IN (FHA|USDA|VA) | 374 | $40,860,000 | $109,251 | $1,244 | 2.91% |
| OWENSBORO, KY (FHA|USDA|VA) | 215 | $37,335,000 | $173,651 | $2,755 | 2.98% |
| SOUTH BEND-MISHAWAKA, IN-MI (FHA|USDA|VA) | 186 | $36,660,000 | $197,097 | $1,472 | 2.77% |
| JANESVILLE-BELOIT, WI (FHA|USDA|VA) | 150 | $34,820,000 | $232,133 | $2,677 | 2.79% |
| DELTONA-DAYTONA BEACH-ORMOND BEACH, FL (FHA|USDA|VA) | 4 | $34,270,000 | $8,567,500 | $3,577 | 2.63% |
| COLUMBUS, IN (FHA|USDA|VA) | 139 | $31,665,000 | $227,806 | $2,075 | 2.84% |
| TALLAHASSEE, FL (FHA|USDA|VA) | 1 | $30,005,000 | $30,005,000 | $0 | 2.80% |
| KALAMAZOO-PORTAGE, MI (FHA|USDA|VA) | 158 | $29,210,000 | $184,873 | $1,854 | 2.77% |
| Holland, MI (FHA|USDA|VA) | 92 | $27,830,000 | $302,500 | $3,120 | 2.80% |
| Oxford, MS (FHA|USDA|VA) | 2 | $27,810,000 | $13,905,000 | $0 | 2.99% |
| KNOXVILLE, TN (FHA|USDA|VA) | 2 | $25,510,000 | $12,755,000 | $4,016 | 2.31% |
| OSHKOSH-NEENAH, WI (FHA|USDA|VA) | 182 | $24,890,000 | $136,758 | $1,932 | 2.86% |
| COLUMBUS, OH (FHA|USDA|VA) | 7 | $22,635,000 | $3,233,571 | $3,027 | 2.72% |
| Jasper, IN (FHA|USDA|VA) | 151 | $21,625,000 | $143,212 | $2,636 | 2.61% |
| APPLETON, WI (FHA|USDA|VA) | 115 | $19,595,000 | $170,391 | $2,149 | 2.71% |
| MUNCIE, IN (FHA|USDA|VA) | 145 | $18,945,000 | $130,655 | $2,067 | 2.97% |
| GREEN BAY, WI (FHA|USDA|VA) | 12 | $16,060,000 | $1,338,333 | $2,145 | 2.68% |
| JACKSON, MI (FHA|USDA|VA) | 73 | $15,505,000 | $212,397 | $1,654 | 2.89% |
| LANSING-EAST LANSING, MI (FHA|USDA|VA) | 19 | $15,115,000 | $795,526 | $2,363 | 2.91% |
| CAPE CORAL-FORT MYERS, FL (FHA|USDA|VA) | 17 | $14,155,000 | $832,647 | $6,968 | 2.85% |
| Central City, KY (FHA|USDA|VA) | 141 | $13,915,000 | $98,688 | $1,094 | 3.02% |
| MONROE, MI (FHA|USDA|VA) | 83 | $13,285,000 | $160,060 | $2,368 | 2.98% |
| FARGO, ND-MN (FHA|USDA|VA) | 1 | $12,105,000 | $12,105,000 | $0 | 3.37% |
| ST. CLOUD, MN (FHA|USDA|VA) | 9 | $12,005,000 | $1,333,889 | $3,483 | 3.24% |
| Whitewater, WI (FHA|USDA|VA) | 64 | $11,770,000 | $183,906 | $2,964 | 2.75% |
| Brainerd, MN (FHA|USDA|VA) | 22 | $11,000,000 | $500,000 | $3,925 | 2.65% |
| ELKHART-GOSHEN, IN (FHA|USDA|VA) | 51 | $10,995,000 | $215,588 | $2,330 | 2.82% |
| NASHVILLE-DAVIDSON-MURFREESBORO-FRANKLIN, TN (FHA|USDA|VA) | 20 | $10,510,000 | $525,500 | $3,681 | 2.99% |
| SAGINAW, MI (FHA|USDA|VA) | 2 | $9,580,000 | $4,790,000 | $0 | 3.05% |
| Stevens Point, WI (FHA|USDA|VA) | 76 | $9,430,000 | $124,079 | $1,654 | 2.84% |
| FLINT, MI (FHA|USDA|VA) | 12 | $8,810,000 | $734,167 | $3,190 | 3.01% |
| NILES, MI (FHA|USDA|VA) | 36 | $8,430,000 | $234,167 | $2,036 | 2.85% |
| Vincennes, IN (FHA|USDA|VA) | 62 | $8,350,000 | $134,677 | $1,850 | 2.88% |
| Seymour, IN (FHA|USDA|VA) | 70 | $7,960,000 | $113,714 | $1,647 | 2.88% |
| BATTLE CREEK, MI (FHA|USDA|VA) | 42 | $7,940,000 | $189,048 | $840 | 2.82% |
| Warsaw, IN (FHA|USDA|VA) | 36 | $7,660,000 | $212,778 | $1,695 | 2.65% |
| Chicago-Naperville-Elgin, IL-IN-WI (FHA|USDA|VA) | 28 | $7,580,000 | $270,714 | $3,371 | 2.99% |
| North Port-Sarasota-Bradenton, FL (FHA|USDA|VA) | 12 | $7,320,000 | $610,000 | $4,314 | 2.92% |
| CEDAR RAPIDS, IA (FHA|USDA|VA) | 1 | $7,155,000 | $7,155,000 | $0 | 2.62% |
| Bedford, IN (FHA|USDA|VA) | 46 | $6,800,000 | $147,826 | $1,721 | 2.77% |
| NAPLES-MARCO ISLAND, FL (FHA|USDA|VA) | 10 | $6,770,000 | $677,000 | $5,684 | 2.84% |
| MUSKEGON, MI (FHA|USDA|VA) | 17 | $6,335,000 | $372,647 | $3,202 | 2.91% |
| Washington, IN (FHA|USDA|VA) | 49 | $5,775,000 | $117,857 | $1,161 | 2.95% |
| RACINE, WI (FHA|USDA|VA) | 22 | $5,650,000 | $256,818 | $2,505 | 3.00% |
| Madisonville, KY (FHA|USDA|VA) | 54 | $5,580,000 | $103,333 | $1,468 | 2.86% |
| BOWLING GREEN, KY (FHA|USDA|VA) | 10 | $5,510,000 | $551,000 | $1,918 | 2.79% |
| Key West, FL (FHA|USDA|VA) | 3 | $5,505,000 | $1,835,000 | $9,809 | 3.20% |
| Sandusky, OH (FHA|USDA|VA) | 3 | $5,395,000 | $1,798,333 | $0 | 3.14% |
| Angola, IN (FHA|USDA|VA) | 11 | $5,255,000 | $477,727 | $2,791 | 2.82% |
| Hutchinson, MN (FHA|USDA|VA) | 28 | $5,060,000 | $180,714 | $3,389 | 2.67% |
| TAMPA-ST. PETERSBURG-CLEARWATER, FL (FHA|USDA|VA) | 8 | $4,690,000 | $586,250 | $5,127 | 2.80% |
| Mount Pleasant, MI (FHA|USDA|VA) | 1 | $4,315,000 | $4,315,000 | $0 | 3.25% |
| Hillsdale, MI (FHA|USDA|VA) | 27 | $4,265,000 | $157,963 | $2,385 | 2.86% |
| North Vernon, IN (FHA|USDA|VA) | 38 | $3,890,000 | $102,368 | $1,413 | 2.77% |
| CRESTVIEW-FORT WALTON BEACH-DESTIN, FL (FHA|USDA|VA) | 3 | $3,865,000 | $1,288,333 | $11,793 | 3.17% |
| Traverse City, MI (FHA|USDA|VA) | 11 | $3,855,000 | $350,455 | $3,332 | 2.55% |
| CINCINNATI, OH-KY-IN (FHA|USDA|VA) | 10 | $3,740,000 | $374,000 | $5,287 | 3.08% |
| ATLANTA-SANDY SPRINGS-ALPHARETTA, GA (FHA|USDA|VA) | 7 | $3,505,000 | $500,714 | $3,940 | 3.07% |
| PHOENIX-MESA-CHANDLER, AZ (FHA|USDA|VA) | 8 | $3,440,000 | $430,000 | $4,186 | 2.92% |
| Beaver Dam, WI (FHA|USDA|VA) | 17 | $3,435,000 | $202,059 | $2,554 | 3.02% |
| Sturgis, MI (FHA|USDA|VA) | 7 | $3,425,000 | $489,286 | $2,858 | 2.55% |
| MANKATO, MN (FHA|USDA|VA) | 25 | $3,185,000 | $127,400 | $2,656 | 2.85% |
| Heber, UT (FHA|USDA|VA) | 1 | $2,765,000 | $2,765,000 | $7,671 | 2.88% |
| ORLANDO-KISSIMMEE-SANFORD, FL (FHA|USDA|VA) | 3 | $2,715,000 | $905,000 | $7,524 | 3.19% |
| Ludington, MI (FHA|USDA|VA) | 5 | $2,585,000 | $517,000 | $3,581 | 3.00% |
| Miami-Fort Lauderdale-Pompano Beach, FL (FHA|USDA|VA) | 6 | $2,580,000 | $430,000 | $5,702 | 2.48% |
| CLEVELAND-ELYRIA, OH (FHA|USDA|VA) | 1 | $2,545,000 | $2,545,000 | $0 | 2.38% |
| Plymouth, IN (FHA|USDA|VA) | 2 | $2,470,000 | $1,235,000 | $8,174 | 2.31% |
| TOLEDO, OH (FHA|USDA|VA) | 5 | $2,315,000 | $463,000 | $3,511 | 3.05% |
| Watertown-Fort Atkinson, WI (FHA|USDA|VA) | 14 | $2,260,000 | $161,429 | $2,304 | 2.97% |
| Madison, IN (FHA|USDA|VA) | 16 | $2,040,000 | $127,500 | $2,018 | 2.72% |
| Baraboo, WI (FHA|USDA|VA) | 10 | $2,040,000 | $204,000 | $2,452 | 2.71% |
| Coldwater, MI (FHA|USDA|VA) | 4 | $1,970,000 | $492,500 | $2,768 | 2.99% |
| ASHEVILLE, NC (FHA|USDA|VA) | 5 | $1,935,000 | $387,000 | $3,732 | 3.43% |
| ROCHESTER, MN (FHA|USDA|VA) | 7 | $1,915,000 | $273,571 | $3,114 | 2.89% |
| DANVILLE, IL (FHA|USDA|VA) | 27 | $1,915,000 | $70,926 | $1,342 | 3.22% |
| Richmond-Berea, KY (FHA|USDA|VA) | 4 | $1,860,000 | $465,000 | $5,319 | 2.75% |
| BOULDER, CO (FHA|USDA|VA) | 1 | $1,835,000 | $1,835,000 | $4,954 | 2.75% |
| Faribault-Northfield, MN (FHA|USDA|VA) | 6 | $1,810,000 | $301,667 | $5,617 | 2.31% |
| RIVERSIDE-SAN BERNARDINO-ONTARIO, CA (FHA|USDA|VA) | 4 | $1,740,000 | $435,000 | $3,674 | 3.06% |
| EAU CLAIRE, WI (FHA|USDA|VA) | 13 | $1,715,000 | $131,923 | $2,335 | 2.88% |
| FOND DU LAC, WI (FHA|USDA|VA) | 11 | $1,715,000 | $155,909 | $2,365 | 2.66% |
| LAKE HAVASU CITY-KINGMAN, AZ (FHA|USDA|VA) | 2 | $1,710,000 | $855,000 | $8,580 | 3.19% |
| Frankfort, IN (FHA|USDA|VA) | 11 | $1,685,000 | $153,182 | $2,095 | 3.02% |
| Crawfordsville, IN (FHA|USDA|VA) | 12 | $1,670,000 | $139,167 | $1,915 | 2.66% |
| KOKOMO, IN (FHA|USDA|VA) | 8 | $1,460,000 | $182,500 | $1,486 | 3.41% |
| PUNTA GORDA, FL (FHA|USDA|VA) | 4 | $1,410,000 | $352,500 | $4,522 | 3.03% |
| WAUSAU-WESTON, WI (FHA|USDA|VA) | 8 | $1,380,000 | $172,500 | $2,612 | 2.70% |
| DAPHNE-FAIRHOPE-FOLEY, AL (FHA|USDA|VA) | 3 | $1,285,000 | $428,333 | $2,851 | 2.63% |
| Frankfort, KY (FHA|USDA|VA) | 4 | $1,280,000 | $320,000 | $4,980 | 2.47% |
| Los Angeles-Long Beach-Anaheim, CA (FHA|USDA|VA) | 2 | $1,220,000 | $610,000 | $3,572 | 2.56% |
| CHARLESTON-NORTH CHARLESTON, SC (FHA|USDA|VA) | 2 | $1,180,000 | $590,000 | $2,639 | 3.13% |
| HILTON HEAD ISLAND-BLUFFTON, SC (FHA|USDA|VA) | 2 | $1,170,000 | $585,000 | $5,221 | 3.06% |
| Edwards, CO (FHA|USDA|VA) | 1 | $1,155,000 | $1,155,000 | $4,509 | 3.38% |
| New Castle, IN (FHA|USDA|VA) | 9 | $1,135,000 | $126,111 | $2,803 | 2.65% |
| Shawano, WI (FHA|USDA|VA) | 4 | $1,110,000 | $277,500 | $2,159 | 2.69% |
| TUCSON, AZ (FHA|USDA|VA) | 3 | $1,095,000 | $365,000 | $4,424 | 2.83% |
| SHEBOYGAN, WI (FHA|USDA|VA) | 5 | $1,055,000 | $211,000 | $2,834 | 2.98% |
| SALT LAKE CITY, UT (FHA|USDA|VA) | 2 | $1,050,000 | $525,000 | $5,025 | 2.69% |
| DULUTH, MN-WI (FHA|USDA|VA) | 5 | $995,000 | $199,000 | $2,534 | 2.98% |
| Platteville, WI (FHA|USDA|VA) | 9 | $975,000 | $108,333 | $1,726 | 2.83% |
| PENSACOLA-FERRY PASS-BRENT, FL (FHA|USDA|VA) | 2 | $970,000 | $485,000 | $5,212 | 2.63% |
| Alexandria, MN (FHA|USDA|VA) | 3 | $895,000 | $298,333 | $3,117 | 2.75% |
| Philadelphia-Camden-Wilmington, PA-NJ-DE-MD (FHA|USDA|VA) | 2 | $880,000 | $440,000 | $5,636 | 2.44% |
| Willmar, MN (FHA|USDA|VA) | 4 | $860,000 | $215,000 | $2,763 | 2.09% |
| PRESCOTT VALLEY-PRESCOTT, AZ (FHA|USDA|VA) | 1 | $855,000 | $855,000 | $7,537 | 3.00% |
| Iron Mountain, MI-WI (FHA|USDA|VA) | 2 | $820,000 | $410,000 | $2,479 | 2.94% |
| RICHMOND, VA (FHA|USDA|VA) | 1 | $815,000 | $815,000 | $5,311 | 2.75% |
| Wisconsin Rapids-Marshfield, WI (FHA|USDA|VA) | 8 | $790,000 | $98,750 | $2,555 | 3.01% |
| BALTIMORE-COLUMBIA-TOWSON, MD (FHA|USDA|VA) | 1 | $765,000 | $765,000 | $0 | 3.55% |
| San Francisco-Oakland-Berkeley, CA (FHA|USDA|VA) | 1 | $765,000 | $765,000 | $4,010 | 2.50% |
| DENVER-AURORA-LAKEWOOD, CO (FHA|USDA|VA) | 2 | $760,000 | $380,000 | $2,611 | 3.13% |
| FORT COLLINS, CO (FHA|USDA|VA) | 1 | $755,000 | $755,000 | $3,050 | 3.25% |
| Marshall, MN (FHA|USDA|VA) | 2 | $730,000 | $365,000 | $3,514 | 3.00% |
| CHARLOTTE-CONCORD-GASTONIA, NC-SC (FHA|USDA|VA) | 2 | $700,000 | $350,000 | $4,255 | 2.56% |
| CLARKSVILLE, TN-KY (FHA|USDA|VA) | 4 | $670,000 | $167,500 | $1,633 | 3.25% |
| Red Wing, MN (FHA|USDA|VA) | 3 | $665,000 | $221,667 | $5,092 | 2.25% |
| ELIZABETHTOWN-FORT KNOX, KY (FHA|USDA|VA) | 2 | $650,000 | $325,000 | $2,340 | 2.88% |
| Kendallville, IN (FHA|USDA|VA) | 4 | $610,000 | $152,500 | $2,366 | 2.50% |
| Breckenridge, CO (FHA|USDA|VA) | 2 | $610,000 | $305,000 | $3,209 | 2.69% |
| VIRGINIA BEACH-NORFOLK-NEWPORT NEWS, VA-NC (FHA|USDA|VA) | 2 | $590,000 | $295,000 | $3,189 | 2.81% |
| Decatur, IN (FHA|USDA|VA) | 4 | $570,000 | $142,500 | $2,078 | 2.31% |
| Charleston-Mattoon, IL (FHA|USDA|VA) | 2 | $560,000 | $280,000 | $0 | 3.84% |
| KINGSPORT-BRISTOL, TN-VA (FHA|USDA|VA) | 1 | $545,000 | $545,000 | $3,872 | 2.63% |
| Centralia, WA (FHA|USDA|VA) | 1 | $545,000 | $545,000 | $3,663 | 2.50% |
| Sevierville, TN (FHA|USDA|VA) | 2 | $540,000 | $270,000 | $0 | 3.56% |
| Washington-Arlington-Alexandria, DC-VA-MD-WV (FHA|USDA|VA) | 1 | $525,000 | $525,000 | $4,271 | 2.75% |
| Huntington, IN (FHA|USDA|VA) | 5 | $515,000 | $103,000 | $1,884 | 2.60% |
| DAYTON-KETTERING, OH (FHA|USDA|VA) | 2 | $500,000 | $250,000 | $3,555 | 3.25% |
| TULSA, OK (FHA|USDA|VA) | 2 | $500,000 | $250,000 | $3,458 | 3.25% |
| Freeport, IL (FHA|USDA|VA) | 3 | $495,000 | $165,000 | $3,829 | 2.50% |
| Bluffton, IN (FHA|USDA|VA) | 3 | $495,000 | $165,000 | $2,127 | 3.13% |
| IOWA CITY, IA (FHA|USDA|VA) | 1 | $495,000 | $495,000 | $3,721 | 3.13% |
| PORT ST. LUCIE, FL (FHA|USDA|VA) | 2 | $480,000 | $240,000 | $4,215 | 3.19% |
| Logansport, IN (FHA|USDA|VA) | 3 | $475,000 | $158,333 | $3,889 | 2.75% |
| GREENVILLE-ANDERSON, SC (FHA|USDA|VA) | 1 | $435,000 | $435,000 | $3,629 | 3.25% |
| Mount Sterling, KY (FHA|USDA|VA) | 2 | $430,000 | $215,000 | $5,989 | 3.00% |
| Manitowoc, WI (FHA|USDA|VA) | 3 | $415,000 | $138,333 | $2,252 | 2.96% |
| OGDEN-CLEARFIELD, UT (FHA|USDA|VA) | 1 | $405,000 | $405,000 | $4,092 | 2.88% |
| JACKSONVILLE, FL (FHA|USDA|VA) | 1 | $395,000 | $395,000 | $3,819 | 2.13% |
| Cadillac, MI (FHA|USDA|VA) | 1 | $375,000 | $375,000 | $3,208 | 2.25% |
| BILLINGS, MT (FHA|USDA|VA) | 1 | $365,000 | $365,000 | $3,959 | 2.88% |
| Big Rapids, MI (FHA|USDA|VA) | 3 | $355,000 | $118,333 | $1,370 | 3.58% |
| Auburn, IN (FHA|USDA|VA) | 3 | $355,000 | $118,333 | $1,237 | 2.58% |
| Marinette, WI-MI (FHA|USDA|VA) | 2 | $350,000 | $175,000 | $2,807 | 3.58% |
| MONROE, LA (FHA|USDA|VA) | 1 | $315,000 | $315,000 | $9,584 | 3.13% |
| Marion, IN (FHA|USDA|VA) | 3 | $305,000 | $101,667 | $2,384 | 3.25% |
| Greensburg, IN (FHA|USDA|VA) | 1 | $305,000 | $305,000 | $3,621 | 3.00% |
| New Ulm, MN (FHA|USDA|VA) | 2 | $300,000 | $150,000 | $3,267 | 2.63% |
| BARNSTABLE TOWN, MA (FHA|USDA|VA) | 1 | $295,000 | $295,000 | $4,279 | 2.88% |
| Fergus Falls, MN (FHA|USDA|VA) | 1 | $295,000 | $295,000 | $3,298 | 3.00% |
| LA CROSSE-ONALASKA, WI-MN (FHA|USDA|VA) | 2 | $290,000 | $145,000 | $2,423 | 3.25% |
| PORTLAND-VANCOUVER-HILLSBORO, OR-WA (FHA|USDA|VA) | 1 | $285,000 | $285,000 | $2,946 | 2.88% |
| OCALA, FL (FHA|USDA|VA) | 1 | $235,000 | $235,000 | $7,436 | 2.63% |
| RALEIGH-CARY, NC (FHA|USDA|VA) | 1 | $215,000 | $215,000 | $2,219 | 2.88% |
| Cullowhee, NC (FHA|USDA|VA) | 1 | $205,000 | $205,000 | $3,297 | 3.50% |
| LYNCHBURG, VA (FHA|USDA|VA) | 1 | $205,000 | $205,000 | $2,987 | 3.63% |
| THE VILLAGES, FL (FHA|USDA|VA) | 1 | $195,000 | $195,000 | $3,505 | 3.00% |
| Winona, MN (FHA|USDA|VA) | 1 | $195,000 | $195,000 | $299 | 3.38% |
| COLUMBIA, MO (FHA|USDA|VA) | 1 | $195,000 | $195,000 | $1,532 | 2.75% |
| Danville, KY (FHA|USDA|VA) | 1 | $175,000 | $175,000 | $2,046 | 2.25% |
| ROCKFORD, IL (FHA|USDA|VA) | 2 | $160,000 | $80,000 | $2,916 | 3.00% |
| Grand Rapids, MN (FHA|USDA|VA) | 1 | $155,000 | $155,000 | $629 | 3.78% |
| Aberdeen, SD (FHA|USDA|VA) | 1 | $145,000 | $145,000 | $4,539 | 2.75% |
| ROME, GA (FHA|USDA|VA) | 1 | $135,000 | $135,000 | $2,677 | 2.88% |
| MEMPHIS, TN-MS-AR (FHA|USDA|VA) | 1 | $135,000 | $135,000 | $0 | 4.00% |
| PALM BAY-MELBOURNE-TITUSVILLE, FL (FHA|USDA|VA) | 1 | $135,000 | $135,000 | $3,308 | 2.50% |
| Crossville, TN (FHA|USDA|VA) | 1 | $135,000 | $135,000 | $2,750 | 2.88% |
| PITTSBURGH, PA (FHA|USDA|VA) | 1 | $125,000 | $125,000 | $2,986 | 3.00% |
| LAS VEGAS-HENDERSON-PARADISE, NV (FHA|USDA|VA) | 1 | $125,000 | $125,000 | $2,012 | 3.13% |
| New York-Newark-Jersey City, NY-NJ-PA (FHA|USDA|VA) | 1 | $115,000 | $115,000 | $5,074 | 3.13% |
| Fairmont, MN (FHA|USDA|VA) | 1 | $115,000 | $115,000 | $2,686 | 3.25% |
| Richmond, IN (FHA|USDA|VA) | 2 | $110,000 | $55,000 | $299 | 3.01% |
| Chillicothe, OH (FHA|USDA|VA) | 1 | $105,000 | $105,000 | $2,945 | 3.25% |
| Van Wert, OH (FHA|USDA|VA) | 1 | $95,000 | $95,000 | $2,687 | 2.75% |
| Peru, IN (FHA|USDA|VA) | 1 | $95,000 | $95,000 | $1,835 | 3.38% |
| Austin, MN (FHA|USDA|VA) | 1 | $85,000 | $85,000 | $2,401 | 2.75% |
| HUNTINGTON-ASHLAND, WV-KY-OH (FHA|USDA|VA) | 1 | $85,000 | $85,000 | $1,846 | 2.50% |
| SPRINGFIELD, OH (FHA|USDA|VA) | 1 | $85,000 | $85,000 | $3,109 | 2.88% |
| Scottsburg, IN (FHA|USDA|VA) | 1 | $85,000 | $85,000 | $2,406 | 3.50% |
| CARBONDALE-MARION, IL (FHA|USDA|VA) | 1 | $55,000 | $55,000 | $0 | 2.99% |
| Albert Lea, MN (FHA|USDA|VA) | 1 | $55,000 | $55,000 | $0 | 1.99% |
| Mount Vernon, IL (FHA|USDA|VA) | 1 | $25,000 | $25,000 | $0 | 2.74% |
| Greenville, OH (FHA|USDA|VA) | 1 | $25,000 | $25,000 | $0 | 2.74% |
Similar Lenders
We use machine learning to identify the top lenders compared against Old National Bank based on their rates and fees, along with other useful metrics. A lower similarity rank signals a stronger match.
Similarity Rank: 20
Similarity Rank: 48
Similarity Rank: 60
Similarity Rank: 144
Similarity Rank: 144
Similarity Rank: 150
Similarity Rank: 167
Similarity Rank: 180
Similarity Rank: 224
Similarity Rank: 228
Product Mix
For 2021, Old National Bank's most frequently originated type of loan was Conventional, with 8,284 originations. Their 2nd most popular type was HELOC, with 3,695 originations.
Loan Reason
For 2021, Old National Bank's most frequently cited loan purpose was Refi, with 4,624 originations. The 2nd most popular reason was Home Purchase, with 3,593 originations.
Loan Duration/Length
For 2021, Old National Bank's most frequently cited loan duration was 30 Year, with 8,200 originations. The 2nd most popular length was 15 Year, with 2,170 originations.
Origination Fees/Closing Costs
Old National Bank's average total fees were $2,782, while their most frequently occuring range of origination fees (closing costs) were in the $<1k bucket, with 6,060 originations.
Interest Rates
During 2021, Old National Bank's average interest rate for loans was 2.71%, while their most frequently originated rate bucket for loans was 2.5-3%, with 4,307 originations.
Loan Sizing
2021 saw Old National Bank place emphasis on $100k-200k loans with 4,062 originations, totaling $575,180,000 in origination value.
Applicant Income
Old National Bank lent most frequently to those with incomes in the $100k-150k range, with 2,445 originations. The second most popular income band? $50k-75k, with 2,240 originations.
Applicant Debt to Income Ratio
Old National Bank lent most frequently to those with DTI ratios of 20-30%, with 3,824 originations. The next most common DTI ratio? <20%, with 2,399 originations.
Ethnicity Mix
Approval Rates
Total approvals of all applications85.35%
Old National Bank has an average approval rate.
Pick Rate
Approvals leading to origination88.78%
Old National Bank has an average pick rate.
Points and Fees
| Points | Originations | Total Value | Average Loan |
|---|---|---|---|
| NA | 12,287 | $3,321,585,000 | $270,333 |
Occupancy Type Mix
| Dwelling Type | Originations | Total Value | Average Loan |
|---|---|---|---|
| 12,287 | $3,321,585,000 | $270,333 |
LTV Distribution
Complaints
| Bank Name | Product | Issue | 2021 CPFB Complaints | % of Total Issues |
|---|---|---|---|---|
| OLD NATIONAL BANK | FHA mortgage | Struggling to pay mortgage | 1 | 50.0% |
| OLD NATIONAL BANK | Other type of mortgage | Applying for a mortgage or refinancing an existing mortgage | 1 | 50.0% |
Bank Details
Branches
| Bank Name | Branch | Branch Type | Deposits (000's) |
|---|---|---|---|
| Old National Bank | 1 Main Street Evansville, IN 47708 | Full Service B&M | $1,351,986 |
| Old National Bank | 1 Monument Circle, Ste 150 Indianapolis, IN 46204 | Full Service B&M | $526,131 |
| Old National Bank | 100 E 8th Street, Ste. 100 Holland, MI 49423 | Full Service B&M | $13,772 |
| Old National Bank | 100 North 2nd Street Lafayette, IN 47901 | Full Service B&M | $163,495 |
| Old National Bank | 100 South Meridian Street Winchester, IN 47394 | Full Service B&M | $136,205 |
| Old National Bank | 10140 Lima Road Fort Wayne, IN 46818 | Full Service B&M | $74,312 |
| Old National Bank | 1030 Hastings Avenue St. Paul Park, MN 55071 | Full Service B&M | $42,544 |
| Old National Bank | 10710 Town Square Drive N.E. Blaine, MN 55449 | Full Service B&M | $314,718 |
| Old National Bank | 110 W Vine Street, Ste. 100 Lexington, KY 40507 | Full Service B&M | $65,749 |
| Old National Bank | 111 East Main Street Manchester, MI 48158 | Full Service B&M | $46,730 |
| Old National Bank | 111 S 2nd St Mankato, MN 56001 | Full Service B&M | $52,519 |
| Old National Bank | 1117 E. Tipton Street Seymour, IN 47274 | Full Service B&M | $99,615 |
| Old National Bank | 1155 Main Street Ferdinand, IN 47532 | Full Service B&M | $125,610 |
| Old National Bank | 116 East Berry Street Fort Wayne, IN 46802 | Full Service B&M | $196,091 |
| Old National Bank | 116 W. Charles Street Muncie, IN 47305 | Full Service B&M | $119,852 |
| Old National Bank | 11850 Fountains Way Maple Grove, MN 55369 | Full Service B&M | $73,647 |
| Old National Bank | 120 North Buffalo Street Warsaw, IN 46580 | Full Service B&M | $37,598 |
| Old National Bank | 1215 Southtown Blvd. Owensboro, KY 42301 | Full Service B&M | $23,693 |
| Old National Bank | 1220 W Northland Avenue Appleton, WI 54914 | Full Service B&M | $71,556 |
| Old National Bank | 1227 James Avenue Bedford, IN 47421 | Full Service B&M | $42,746 |
| Old National Bank | 123 West 4th Street, Ste. 100 Owensboro, KY 42303 | Full Service B&M | $63,761 |
| Old National Bank | 1233 Eddy Street, Suite 101 South Bend, IN 46617 | Full Service B&M | $36,783 |
| Old National Bank | 1240 County Road E Arden Hills, MN 55112 | Full Service B&M | $255,158 |
| Old National Bank | 130 North Morgan Street Morganfield, KY 42437 | Full Service B&M | $77,908 |
| Old National Bank | 130 South Main Street Suite 100 South Bend, IN 46601 | Full Service B&M | $45,940 |
| Old National Bank | 1305 Veterans Parkway Clarksville, IN 47129 | Full Service B&M | $2,850 |
| Old National Bank | 131 East Main Cross Street Greenville, KY 42345 | Full Service B&M | $216,233 |
| Old National Bank | 133 Old Highway Road Tell City, IN 47586 | Full Service B&M | $151,278 |
| Old National Bank | 135 Central Avenue North Wayzata, MN 55391 | Full Service B&M | $406,888 |
| Old National Bank | 1360 Duckwood Drive Eagan, MN 55123 | Full Service B&M | $289,544 |
| Old National Bank | 140 Columbia Avenue West Battle Creek, MI 49015 | Full Service B&M | $76,892 |
| Old National Bank | 140 S Creasy Lane Lafayette, IN 47905 | Full Service B&M | $83,228 |
| Old National Bank | 1407 Vierling Dr E Shakopee, MN 55379 | Full Service B&M | $112,684 |
| Old National Bank | 14141 Glendale Road Savage, MN 55378 | Full Service B&M | $159,982 |
| Old National Bank | 1420 North State Street North Vernon, IN 47265 | Full Service B&M | $100,392 |
| Old National Bank | 1422 South Winter Street Adrian, MI 49221 | Full Service B&M | $187,164 |
| Old National Bank | 1430 S Rangeline Rd Carmel, IN 46032 | Full Service B&M | $134,565 |
| Old National Bank | 14665 Galaxie Avenue, Ste. 100 Apple Valley, MN 55124 | Full Service B&M | $69,417 |
| Old National Bank | 1490 North Green Street Brownsburg, IN 46112 | Full Service B&M | $32,704 |
| Old National Bank | 1510 W Southport Road Indianapolis, IN 46217 | Full Service B&M | $47,136 |
| Old National Bank | 1516 West Main Street Sun Prairie, WI 53590 | Full Service B&M | $54,277 |
| Old National Bank | 1570 Concordia Avenue, Ste. 100 Saint Paul, MN 55104 | Full Service B&M | $328,276 |
| Old National Bank | 15941 Cumberland Road Noblesville, IN 46060 | Full Service B&M | $32,149 |
| Old National Bank | 1600 Utica Avenue S., Suite 400 Saint Louis Park, MN 55416 | Full Service B&M | $0 |
| Old National Bank | 161 Monroe Street, N.W. Grand Rapids, MI 49503 | Full Service B&M | $77,484 |
| Old National Bank | 1630 Arboretum Blvd Victoria, MN 55386 | Full Service B&M | $66,965 |
| Old National Bank | 16677 Duluth Avenue, S.E. Prior Lake, MN 55372 | Full Service B&M | $203,237 |
| Old National Bank | 1703 West Broadway Princeton, IN 47670 | Full Service B&M | $130,299 |
| Old National Bank | 1800 Lincoln Avenue Evansville, IN 47714 | Limited, Mobile/Seasonal Office | $0 |
| Old National Bank | 1825 Lafayette Avenue Terre Haute, IN 47804 | Full Service B&M | $60,048 |
| Old National Bank | 1889 Springdale Street Mount Horeb, WI 53572 | Full Service B&M | $25,731 |
| Old National Bank | 1903 South 11th Street Niles, MI 49120 | Full Service B&M | $53,529 |
| Old National Bank | 1905 Hart Street Vincennes, IN 47591 | Full Service B&M | $60,954 |
| Old National Bank | 1920 Donegal Drive Woodbury, MN 55125 | Full Service B&M | $67,726 |
| Old National Bank | 19943 County Road 43 Big Lake, MN 55309 | Full Service B&M | $75,285 |
| Old National Bank | 2 West Main Street Danville, IL 61832 | Full Service B&M | $152,972 |
| Old National Bank | 20 North Third Street Vincennes, IN 47591 | Full Service B&M | $175,859 |
| Old National Bank | 200 North Maple Saline, MI 48176 | Full Service B&M | $114,718 |
| Old National Bank | 205 East Chicago Boulevard Tecumseh, MI 49286 | Full Service B&M | $113,520 |
| Old National Bank | 205 W Grand River Ave, Ste 102 Brighton, MI 48116 | Full Service B&M | $39,679 |
| Old National Bank | 209 W. Louis Glick Highway Jackson, MI 49201 | Full Service B&M | $51,102 |
| Old National Bank | 210 Paul Avenue North Cologne, MN 55322 | Full Service B&M | $49,468 |
| Old National Bank | 2121 West Franklin Street Evansville, IN 47712 | Full Service B&M | $183,258 |
| Old National Bank | 216 Cottage Grove Road Madison, WI 53716 | Full Service B&M | $113,475 |
| Old National Bank | 219 South Scatterfield Road Anderson, IN 46012 | Full Service B&M | $103,251 |
| Old National Bank | 2215 Holiday Drive Janesville, WI 53545 | Full Service B&M | $67,926 |
| Old National Bank | 222 6th Avenue Madison, MN 56256 | Full Service B&M | $48,396 |
| Old National Bank | 224 West Main Street Boonville, IN 47601 | Full Service B&M | $94,143 |
| Old National Bank | 23 West Main Street Madison, WI 53703 | Full Service B&M | $142,696 |
| Old National Bank | 2312 Charles Street Anderson, IN 46013 | Full Service B&M | $35,441 |
| Old National Bank | 2401 South Madison Street Muncie, IN 47302 | Full Service B&M | $54,083 |
| Old National Bank | 2429 Poplar Street Terre Haute, IN 47803 | Full Service B&M | $53,659 |
| Old National Bank | 2431 North Vermilion Street Danville, IL 61832 | Full Service B&M | $43,448 |
| Old National Bank | 2490 S Walnut St Bloomington, IN 47401 | Full Service B&M | $134,492 |
| Old National Bank | 25 E Washington St Greencastle, IN 46135 | Full Service B&M | $154,903 |
| Old National Bank | 260 Tecumseh Street Dundee, MI 48131 | Full Service B&M | $76,368 |
| Old National Bank | 2700 East Seventh Avenue North Saint Paul, MN 55109 | Full Service B&M | $102,603 |
| Old National Bank | 2723 South State Street, Ste 110 Ann Arbor, MI 48104 | Full Service B&M | $215,730 |
| Old National Bank | 2801 E Buick Cadillac Blvd Bloomington, IN 47401 | Full Service B&M | $256,034 |
| Old National Bank | 2929 N Sherman Ave Madison, WI 53704 | Full Service B&M | $112,218 |
| Old National Bank | 300 E Kirkwood Ave Bloomington, IN 47408 | Full Service B&M | $290,209 |
| Old National Bank | 301 Chestnut Street Chaska, MN 55318 | Full Service B&M | $170,701 |
| Old National Bank | 301 Second Street Henderson, KY 42420 | Full Service B&M | $151,462 |
| Old National Bank | 301 South 2nd Street Central City, KY 42330 | Full Service B&M | $38,064 |
| Old National Bank | 302 North Midvale Blvd Madison, WI 53705 | Full Service B&M | $111,708 |
| Old National Bank | 3100 North Morrison Road Muncie, IN 47304 | Full Service B&M | $60,593 |
| Old National Bank | 311 S.E. 21st Street Washington, IN 47501 | Full Service B&M | $145,926 |
| Old National Bank | 320 North Main Elkhart, IN 46516 | Full Service B&M | $90,848 |
| Old National Bank | 3201 Portage Street Kalamazoo, MI 49001 | Full Service B&M | $81,246 |
| Old National Bank | 3230 Mount Moriah Avenue Owensboro, KY 42303 | Full Service B&M | $30,960 |
| Old National Bank | 324 East Hospital Road Paoli, IN 47454 | Full Service B&M | $87,381 |
| Old National Bank | 324 Oak Street Farmington, MN 55024 | Full Service B&M | $85,784 |
| Old National Bank | 327 East Fourth Street Huntingburg, IN 47542 | Full Service B&M | $51,684 |
| Old National Bank | 331 West Main Street Hudson, MI 49247 | Full Service B&M | $62,443 |
| Old National Bank | 333 E Main St, Ste 100 Louisville, KY 40202 | Full Service B&M | $163,053 |
| Old National Bank | 333 S Westfield Rd Madison, WI 53717 | Full Service B&M | $62,797 |
| Old National Bank | 3503 Paramount Drive West Lafayette, IN 47906 | Full Service B&M | $48,928 |
| Old National Bank | 3535 North Green River Road Evansville, IN 47715 | Full Service B&M | $73,657 |
| Old National Bank | 3603 Newton Street Jasper, IN 47546 | Full Service B&M | $49,375 |
| Old National Bank | 3805 25th Street Columbus, IN 47203 | Full Service B&M | $108,772 |
| Old National Bank | 385 South Main Street Zionsville, IN 46077 | Full Service B&M | $110,201 |
| Old National Bank | 3888 First Avenue Evansville, IN 47710 | Full Service B&M | $178,494 |
| Old National Bank | 3950 Vinewood Lane N Plymouth, MN 55441 | Full Service B&M | $58,484 |
| Old National Bank | 401 Washington Street Covington, IN 47932 | Full Service B&M | $124,005 |
| Old National Bank | 402 Main Street Mount Vernon, IN 47620 | Full Service B&M | $89,802 |
| Old National Bank | 407 South Main Street Clinton, IN 47842 | Full Service B&M | $99,495 |
| Old National Bank | 4191 West Third Street Bloomington, IN 47404 | Full Service B&M | $171,995 |
| Old National Bank | 420 South Koeller Street Front Oshkosh, WI 54902 | Full Service B&M | $90,874 |
| Old National Bank | 420 West Verona Avenue Verona, WI 53593 | Full Service B&M | $46,544 |
| Old National Bank | 4201 Shelbyville Road Louisville, KY 40207 | Full Service B&M | $40,677 |
| Old National Bank | 4330 West Jonathon Moore Pike Columbus, IN 47201 | Full Service B&M | $117,420 |
| Old National Bank | 4431 West Centre Avenue Portage, MI 49024 | Full Service B&M | $76,328 |
| Old National Bank | 4500 Washington Avenue Evansville, IN 47714 | Full Service B&M | $232,071 |
| Old National Bank | 4616 West Richland Plaza Bloomington, IN 47404 | Full Service B&M | $65,085 |
| Old National Bank | 4675 Us Highway 41 South Terre Haute, IN 47802 | Full Service B&M | $85,675 |
| Old National Bank | 4708 East Towne Boulevard Madison, WI 53704 | Full Service B&M | $48,722 |
| Old National Bank | 4805 East 96th Street Indianapolis, IN 46240 | Full Service B&M | $49,660 |
| Old National Bank | 4950 East County Line Road Indianapolis, IN 46237 | Full Service B&M | $62,172 |
| Old National Bank | 500 E Walworth Ave Delavan, WI 53115 | Full Service B&M | $32,637 |
| Old National Bank | 5003 Century Avenue Kalamazoo, MI 49006 | Full Service B&M | $145,593 |
| Old National Bank | 501 Hospital Drive Madisonville, KY 42431 | Full Service B&M | $116,129 |
| Old National Bank | 501 Virginia Avenue, Ste 103 Indianapolis, IN 46203 | Full Service B&M | $19,553 |
| Old National Bank | 5015 East Beltline Avenue Ne, Grand Rapids, MI 49525 | Full Service B&M | $45,783 |
| Old National Bank | 5101 South 27th Street Greenfield, WI 53221 | Full Service B&M | $49,135 |
| Old National Bank | 5124 Pearl Drive Evansville, IN 47712 | Full Service B&M | $85,848 |
| Old National Bank | 5200 Cascade Road, S.E. Grand Rapids, MI 49546 | Full Service B&M | $248,433 |
| Old National Bank | 53 West Main Street Waconia, MN 55387 | Full Service B&M | $188,845 |
| Old National Bank | 530 Massachusetts Avenue, Ste. 175 Indianapolis, IN 46204 | Full Service B&M | $5,406 |
| Old National Bank | 544 E. Boonville New Harmony Road Evansville, IN 47725 | Full Service B&M | $111,597 |
| Old National Bank | 550 West Burnsville Parkway, Ste. 100 Burnsville, MN 55337 | Full Service B&M | $22,990 |
| Old National Bank | 5750 Raymond Road Madison, WI 53711 | Full Service B&M | $99,400 |
| Old National Bank | 5920 Brooklyn Boulevard Brooklyn Center, MN 55429 | Full Service B&M | $415 |
| Old National Bank | 600 West 78th Street, P.O. Box 399 Chanhassen, MN 55317 | Full Service B&M | $225,727 |
| Old National Bank | 601 S Main Street De Forest, WI 53532 | Full Service B&M | $44,066 |
| Old National Bank | 602 West Broadway Street Loogootee, IN 47553 | Full Service B&M | $69,638 |
| Old National Bank | 6135 North College Avenue Indianapolis, IN 46220 | Full Service B&M | $101,862 |
| Old National Bank | 630 North 12th Street Montevideo, MN 56265 | Full Service B&M | $110,849 |
| Old National Bank | 640 Division Street Stevens Point, WI 54481 | Full Service B&M | $105,423 |
| Old National Bank | 6430 W. Jefferson Blvd Fort Wayne, IN 46804 | Full Service B&M | $69,295 |
| Old National Bank | 66 E Thompson Avenue E., Ste. A West Saint Paul, MN 55118 | Full Service B&M | $119,973 |
| Old National Bank | 701 Wabash Ave Terre Haute, IN 47807 | Full Service B&M | $266,300 |
| Old National Bank | 7030 Heritage Square Drive Granger, IN 46530 | Full Service B&M | $87,863 |
| Old National Bank | 7200 Dexter-Ann Arbor Road Dexter, MI 48130 | Full Service B&M | $67,872 |
| Old National Bank | 7401 West Greenfield Avenue West Allis, WI 53214 | Full Service B&M | $132,909 |
| Old National Bank | 771 Second Street Jasper, IN 47546 | Full Service B&M | $45,864 |
| Old National Bank | 775 Prairie Center Drive, Ste. 100 Eden Prairie, MN 55344 | Full Service B&M | $44,469 |
| Old National Bank | 790 North Jefferson Street Milwaukee, WI 53202 | Full Service B&M | $25,130 |
| Old National Bank | 800 Faxon Road Norwood Young America, MN 55397 | Full Service B&M | $76,433 |
| Old National Bank | 802 Edwards Drive Plainfield, IN 46168 | Full Service B&M | $54,713 |
| Old National Bank | 835 North Burkhardt Road Evansville, IN 47715 | Full Service B&M | $184,485 |
| Old National Bank | 8577 Ruffian Lane Newburgh, IN 47630 | Full Service B&M | $198,875 |
| Old National Bank | 8600 University Boulevard Evansville, IN 47712 | Limited, Mobile/Seasonal Office | $0 |
| Old National Bank | 886 Sycamore Rockport, IN 47635 | Full Service B&M | $67,251 |
| Old National Bank | 8900 State Hwy 7 St. Bonifacius, MN 55375 | Full Service B&M | $54,723 |
| Old National Bank | 8930 E 56th St Indianapolis, IN 46216 | Full Service B&M | $67,352 |
| Old National Bank | 900 South State Road 135 Greenwood, IN 46143 | Full Service B&M | $63,022 |
| Old National Bank | 910 Commercial Drive Buffalo, MN 55313 | Full Service B&M | $218,833 |
| Old National Bank | 961 Washington Avenue Evansville, IN 47713 | Full Service B&M | $28,428 |
| Old National Bank | 9708 Brownsboro Road Louisville, KY 40241 | Full Service B&M | $66,250 |
| Old National Bank | 971 S. Green Bay Road Neenah, WI 54956 | Full Service B&M | $37,142 |
| Old National Bank | 9720 East U.S. Highway 36 Avon, IN 46123 | Full Service B&M | $25,495 |
| Old National Bank | 9765 E 116th St Fishers, IN 46037 | Full Service B&M | $89,620 |
| Old National Bank | 9898 Illinois Road Fort Wayne, IN 46804 | Full Service B&M | $68,207 |
| Old National Bank | 9901 Fall Creek Road Indianapolis, IN 46256 | Full Service B&M | $73,421 |
| Old National Bank | One Dcb Plaza Jasper, IN 47546 | Full Service B&M | $137,468 |
| Old National Bank | One Main Street Evansville, IN 47708 | Limited, Mobile/Seasonal Office | $0 |
For 2021, Old National Bank had 166 branches.
Yearly Performance Overview
Bank Income
| Item | Value (in 000's) |
|---|---|
| Total interest income | $637,910 |
| Net interest income | $603,946 |
| Total noninterest income | $205,882 |
| Gross Fiduciary activities income | $40,584 |
| Service charges on deposit accounts | $34,685 |
| Trading account gains and fees | $0 |
| Additional Noninterest Income | $130,613 |
| Pre-tax net operating income | $353,235 |
| Securities gains (or losses, -) | $4,520 |
| Income before extraordinary items | $291,312 |
| Discontinued Operations (Extraordinary gains, net) | $0 |
| Net income of bank and minority interests | $291,312 |
| Minority interest net income | $0 |
| Net income | $291,312 |
| Sale, conversion, retirement of capital stock, net | $0 |
| Net operating income | $287,650 |
Old National Bank's gross interest income from loans was $637,910,000.
Old National Bank's net interest income from loans was $603,946,000.
Old National Bank's fee based income from loans was $34,685,000.
Old National Bank's net income from loans was $291,312,000.
Bank Expenses
| Item | Value (in 000's) |
|---|---|
| Total interest expense | $33,964 |
| Provision for credit losses | $-28,812 |
| Total noninterest expense | $485,405 |
| Salaries and employee benefits | $242,912 |
| Premises and equipment expense | $66,994 |
| Additional noninterest expense | $175,499 |
| Applicable income taxes | $66,443 |
| Net charge-offs | $-4,765 |
| Cash dividends | $125,000 |
Old National Bank's interest expense for loans was $33,964,000.
Old National Bank's payroll and benefits expense were $242,912,000.
Old National Bank's property, plant and equipment expenses $66,994,000.
Loan Performance
| Type of Loan | % of Loans Noncurrent (30+ days, end of period snapshot) |
|---|---|
| All loans | 0.0% |
| Real Estate loans | 0.0% |
| Construction & Land Development loans | 0.0% |
| Nonfarm, nonresidential loans | 1.0% |
| Multifamily residential loans | 0.0% |
| 1-4 family residential loans | 0.0% |
| HELOC loans | 0.0% |
| All other family | 0.0% |
| Commercial & industrial loans | 1.0% |
| Personal loans | 0.0% |
| Credit card loans | 0.0% |
| Other individual loans | 0.0% |
| Auto loans | 0.0% |
| Other consumer loans | 0.0% |
| Unsecured commercial real estate loans | 6.0% |
Deposits
| Type | Value (in 000's) |
|---|---|
| Total deposits | $18,678,315 |
| Deposits held in domestic offices | $18,678,315 |
| Deposits by Individuals, partnerships, and corporations | $17,478,537 |
| Deposits by U.S. Government | $46 |
| Deposits by States and political subdivisions in the U.S. | $1,198,872 |
| Deposits by Commercial banks and other depository institutions in U.S. | $861 |
| Deposits by Banks in foreign countries | $0 |
| Deposits by Foreign governments and official institutions | $0 |
| Transaction accounts | $6,615,264 |
| Demand deposits | $6,419,095 |
| Nontransaction accounts | $12,063,052 |
| Money market deposit accounts (MMDAs) | $7,553,806 |
| Other savings deposits (excluding MMDAs) | $3,555,699 |
| Total time deposits | $953,548 |
| Total time and savings deposits | $12,259,221 |
| Noninterest-bearing deposits | $6,419,095 |
| Interest-bearing deposits | $12,259,220 |
| Retail deposits | $18,425,564 |
| IRAs and Keogh plan accounts | $204,120 |
| Brokered deposits | $0 |
| Deposits held in foreign offices | $0 |
Assets
| Asset | Value (in 000's) |
|---|---|
| Total Assets | $24,354,109 |
| Cash & Balances due from depository institutions | $822,019 |
| Interest-bearing balances | $649,356 |
| Total securities | $7,378,131 |
| Federal funds sold & reverse repurchase | $0 |
| Net loans and leases | $13,529,963 |
| Loan and leases loss allowance | $107,341 |
| Trading account assets | $53,421 |
| Bank premises and fixed assets | $545,654 |
| Other real estate owned | $1,917 |
| Goodwill and other intangibles | $1,101,712 |
| All other assets | $921,292 |
Liabilities
| Liabilities | Value (in 000's) |
|---|---|
| Total liabilities and capital | $24,354,109 |
| Total Liabilities | $21,300,534 |
| Total deposits | $18,678,315 |
| Interest-bearing deposits | $12,259,220 |
| Deposits held in domestic offices | $18,678,315 |
| % insured (estimated) | $60 |
| Federal funds purchased and repurchase agreements | $392,552 |
| Trading liabilities | $24,960 |
| Other borrowed funds | $1,956,199 |
| Subordinated debt | $12,000 |
| All other liabilities | $236,508 |
Issued Loan Types
| Type | Value (in 000's) |
|---|---|
| Net loans and leases | $13,529,963 |
| Loan and leases loss allowance | $107,341 |
| Total loans and leases (domestic) | $13,637,304 |
| All real estate loans | $9,481,058 |
| Real estate loans in domestic offices | $9,481,058 |
| Construction and development loans | $1,062,810 |
| Residential 1-4 family construction | $199,007 |
| Other construction, all land development and other land | $863,803 |
| Loans secured by nonfarm nonresidential properties | $3,944,886 |
| Nonfarm nonresidential secured by owner-occupied properties | $1,664,690 |
| Commercial real estate & other non-farm, non-residential | $2,280,196 |
| Multifamily residential real estate | $1,334,348 |
| 1-4 family residential loans | $3,007,061 |
| Farmland loans | $131,953 |
| Loans held in foreign offices | $0 |
| Farm loans | $85,983 |
| Commercial and industrial loans | $2,649,606 |
| To non-U.S. addressees | $0 |
| Loans to individuals | $980,221 |
| Credit card loans | $0 |
| Related Plans | $36,253 |
| Consumer Auto Loans | $868,808 |
| Other loans to individuals | $75,160 |
| All other loans & leases | $440,435 |
| Loans to foreign governments and official institutions | $0 |
| Other loans | $32,937 |
| Loans to depository institutions and acceptances of other banks | $0 |
| Loans not secured by real estate | $203,874 |
| Loans secured by real estate to non-U.S. addressees | $0 |
| Restructured Loans & leases | $18,378 |
| Non 1-4 family restructured loans & leases | $14,262 |
| Total loans and leases (foreign) | $1 |
Old National Bank had $13,529,963,000 of loans outstanding in 2021. $9,481,058,000 of loans were in real estate loans. $1,062,810,000 of loans were in development loans. $1,334,348,000 of loans were in multifamily mortgage loans. $3,007,061,000 of loans were in 1-4 family mortgage loans. $85,983,000 of loans were in farm loans. $0 of loans were in credit card loans. $868,808,000 of loans were in the auto loan category.
Small Business Loans
| Categorization | # of Loans in Category | $ amount of loans (in 000's) | Average $/loan |
|---|---|---|---|
| Nonfarm, nonresidential loans - <$1MM | 2,601 | $743,291 | $285,771 |
| Nonfarm, nonresidential loans - <$100k | 365 | $16,811 | $46,058 |
| Nonfarm, nonresidential loans - $100-250k | 775 | $102,331 | $132,040 |
| Nonfarm, nonresidential loans - $250k-1MM | 1,461 | $624,149 | $427,207 |
| Commercial & Industrial, US addressed loans - <$1MM | 8,784 | $698,490 | $79,518 |
| Commercial & Industrial, US addressed loans - <$100k | 5,533 | $124,576 | $22,515 |
| Commercial & Industrial, US addressed loans - $100-250k | 1,601 | $148,209 | $92,573 |
| Commercial & Industrial, US addressed loans - $250k-1MM | 1,650 | $425,705 | $258,003 |
| Farmland loans - <$1MM | 504 | $62,751 | $124,506 |
| Farmland loans - <$100k | 166 | $6,458 | $38,904 |
| Farmland loans - $100-250k | 207 | $23,854 | $115,237 |
| Farmland loans - $250k-1MM | 131 | $32,439 | $247,626 |
| Agriculture operations loans - <$1MM | 768 | $47,267 | $61,546 |
| Agriculture operations loans - <$100k | 521 | $12,635 | $24,251 |
| Agriculture operations loans - $100-250k | 154 | $14,351 | $93,188 |
| Agriculture operations loans - $250k-1MM | 93 | $20,281 | $218,075 |