Merchants Bank Of Indiana Mortgage Rates, Fees & Info
Carmel, INLEI: 549300WRDGBHKR1BXL98
Tax ID: 35-0352710
Latest/2024 | 2023 Data | 2022 Data | 2021 Data | 2020 Data | 2019 Data | 2018 Data
Jump to:
Mortgage Data
Bank Data
Review & Overview
Merchants Bank Of Indiana is a small bank specializing in Refi and Home Purchase loans. Merchants Bank Of Indiana has a high proportion of conventional loans. They have a a low proportion of FHA loans. (This may mean they shy away from first time homebuyers.) Their top markets by origination volume include: Indianapolis, Chicago, St. Louis, Providence, and Cincinnati among others. We have data for 231 markets. (Some data included below & more in-depth data is available with an active subscription.)Merchants Bank Of Indiana has an above average approval rate when compared to the average across all lenders. They have an above average pick rate when compared to similar lenders. Merchants Bank Of Indiana is typically a low fee lender. (We use the term "fees" to include things like closing costs and other costs incurred by borrowers-- whether they are paid out of pocket or rolled into the loan.) They typically have about average rates.
We show data for every lender and do not change our ratings-- even if an organization is a paid advertiser. Our consensus data does have lag, but it is highly correlated to a lender's rates & fees relative to their markets. This means that if a bank is a low fee/rate lender the past-- chances are they are still one today. Our SimulatedRates™ use advanced statistical techniques to forecast different rates based on a lender's historical data.
Mortgage seekers: Choose your metro area here to explore the lowest fee & rate lenders.
Mortgage professionals: We have various tools to make your lives easier. Contact us to see how we can help with your market research, analytics or advertising needs.
SimulatedRates™Mortgage Type |
Simulated Rate | Simulation Date |
|---|---|---|
| Home Equity Line of Credit (HELOC) | 8.00% | 2/4/26 |
| 30 Year Conventional Purchase | 6.93% | 2/4/26 |
| 30 Year Conventional Refi | 6.62% | 2/4/26 |
| 30 Year Cash-out Refi | 7.12% | 2/4/26 |
| 30 Year FHA Purchase | 7.31% | 2/4/26 |
| 30 Year FHA Refi | 6.95% | 2/4/26 |
| 30 Year VA Purchase | 6.50% | 2/4/26 |
| 30 Year VA Refi | 6.08% | 2/4/26 |
| 30 Year USDA Purchase | 6.95% | 2/4/26 |
| 15 Year Conventional Purchase | 6.35% | 2/4/26 |
| 15 Year Conventional Refi | 6.56% | 2/4/26 |
| 15 Year Cash-out Refi | 6.56% | 2/4/26 |
| These are simulated rates generated by our proprietary machine learning models. These are not guaranteed by the bank. They are our estimates based on a lender's past behaviors combined with current market conditions. Contact an individual lender for their actual rates. Our models use fixed rate terms for conforming loans, 700+ FICO, 10% down for FHA and 20% for conventional. These are based on consensus, historical data-- not advertised promotional rates. | ||
Merchants Bank Of Indiana Mortgage Calculator
Your Estimates
Estimated Loan Payment: Update the calculator values and click calculate payment!
This is not an official calculator from Merchants Bank Of Indiana. It uses our SimulatedRate™
technology, basic math and reasonable assumptions to calculate mortgage payments derived from our simulations and your inputs.
The default purchase price is the median sales price across the US for 2022Q4, per FRED.
Originations
3,602Origination Dollar Volume (All Markets)
$2,789,120,000Employee count
451Awards


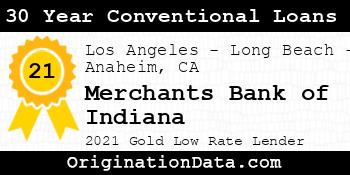
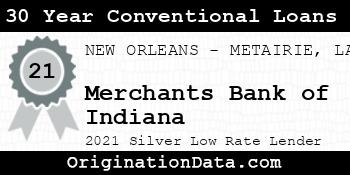
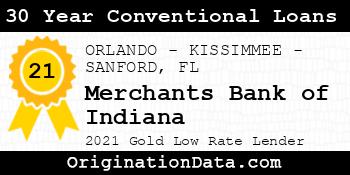
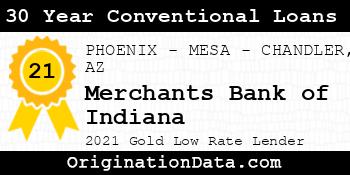

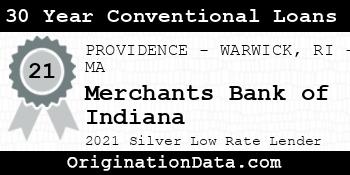


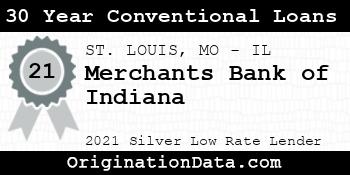
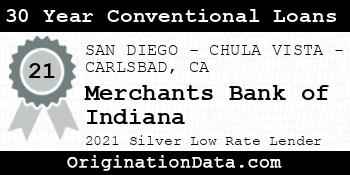
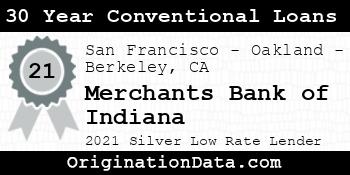

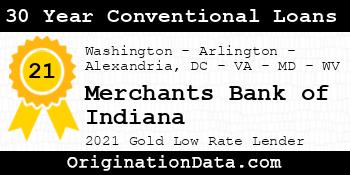

Merchants Bank of Indiana - 2021
Merchants Bank of Indiana is a 2021 , due to their low .
For 2021, less than of lenders were eligible for this award.
Work for Merchants Bank of Indiana?
Use this award on your own site. Either save and use the images below, or pass the provided image embed code to your development team.
Top Markets
Zoom/scroll map to see bank's per metro statistics. Subscribers can configure state/metro/county granularity, assorted fields and quantity of results. This map shows top 10 markets in the map viewport, as defined by descending origination volume.
| Market | Originations | Total Value | Average Loan | Average Fees | Average Rate |
|---|---|---|---|---|---|
| INDIANAPOLIS-CARMEL-ANDERSON, IN (FHA|USDA|VA) | 477 | $413,485,000 | $866,845 | $2,044 | 3.03% |
| Chicago-Naperville-Elgin, IL-IN-WI (FHA|USDA|VA) | 258 | $245,380,000 | $951,085 | $2,830 | 2.75% |
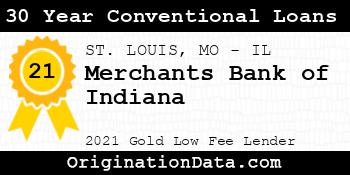
| ST. LOUIS, MO-IL (FHA|USDA|VA) | 563 | $238,475,000 | $423,579 | $1,512 | 2.81% |
| PROVIDENCE-WARWICK, RI-MA (FHA|USDA|VA) | 487 | $142,875,000 | $293,378 | $2,973 | 2.75% |
| CINCINNATI, OH-KY-IN (FHA|USDA|VA) | 26 | $96,980,000 | $3,730,000 | $3,951 | 3.19% |
| FORT WAYNE, IN (FHA|USDA|VA) | 12 | $96,340,000 | $8,028,333 | $1,998 | 3.25% |
| CHARLOTTE-CONCORD-GASTONIA, NC-SC (FHA|USDA|VA) | 19 | $68,565,000 | $3,608,684 | $5,767 | 3.09% |
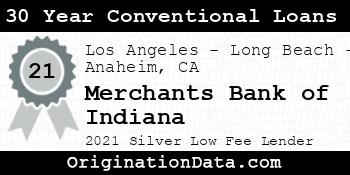
| Los Angeles-Long Beach-Anaheim, CA (FHA|USDA|VA) | 171 | $66,125,000 | $386,696 | $3,768 | 2.68% |
| ATLANTA-SANDY SPRINGS-ALPHARETTA, GA (FHA|USDA|VA) | 48 | $65,580,000 | $1,366,250 | $3,895 | 2.63% |
| Miami-Fort Lauderdale-Pompano Beach, FL (FHA|USDA|VA) | 10 | $62,210,000 | $6,221,000 | $4,277 | 2.66% |
| Dallas-Fort Worth-Arlington, TX (FHA|USDA|VA) | 15 | $61,575,000 | $4,105,000 | $6,446 | 2.86% |
| Washington-Arlington-Alexandria, DC-VA-MD-WV (FHA|USDA|VA) | 28 | $60,630,000 | $2,165,357 | $5,467 | 2.70% |
| SOUTH BEND-MISHAWAKA, IN-MI (FHA|USDA|VA) | 1 | $54,255,000 | $54,255,000 | $0 | 4.00% |
| Boston-Cambridge-Newton, MA-NH (FHA|USDA|VA) | 121 | $45,975,000 | $379,959 | $4,118 | 2.78% |
| SAN ANTONIO-NEW BRAUNFELS, TX (FHA|USDA|VA) | 4 | $43,710,000 | $10,927,500 | $14,195 | 3.88% |
| GRANTS PASS, OR (FHA|USDA|VA) | 2 | $36,000,000 | $18,000,000 | $0 | 6.63% |
| TAMPA-ST. PETERSBURG-CLEARWATER, FL (FHA|USDA|VA) | 15 | $35,485,000 | $2,365,667 | $4,034 | 3.12% |
| COLUMBUS, OH (FHA|USDA|VA) | 125 | $33,725,000 | $269,800 | $2,937 | 2.90% |
| EVANSVILLE, IN-KY (FHA|USDA|VA) | 6 | $33,520,000 | $5,586,667 | $0 | 3.44% |
| San Francisco-Oakland-Berkeley, CA (FHA|USDA|VA) | 55 | $31,635,000 | $575,182 | $4,645 | 2.74% |
| DES MOINES-WEST DES MOINES, IA (FHA|USDA|VA) | 3 | $31,605,000 | $10,535,000 | $2,721 | 3.21% |
| HARTFORD-EAST HARTFORD-MIDDLETOWN, CT (FHA|USDA|VA) | 5 | $28,895,000 | $5,779,000 | $3,779 | 2.71% |
| BLOOMINGTON, IN (FHA|USDA|VA) | 7 | $26,745,000 | $3,820,714 | $3,729 | 3.27% |
| HOUSTON-THE WOODLANDS-SUGAR LAND, TX (FHA|USDA|VA) | 6 | $26,240,000 | $4,373,333 | $6,983 | 3.10% |
| New York-Newark-Jersey City, NY-NJ-PA (FHA|USDA|VA) | 11 | $25,435,000 | $2,312,273 | $6,785 | 2.89% |
| FAYETTEVILLE-SPRINGDALE-ROGERS, AR (FHA|USDA|VA) | 2 | $25,220,000 | $12,610,000 | $8,080 | 2.81% |
| CUMBERLAND, MD-WV (FHA|USDA|VA) | 1 | $25,005,000 | $25,005,000 | $0 | 3.60% |
| VALDOSTA, GA (FHA|USDA|VA) | 1 | $22,575,000 | $22,575,000 | $0 | 3.05% |
| RAPID CITY, SD (FHA|USDA|VA) | 2 | $20,430,000 | $10,215,000 | $0 | 3.75% |
| MEMPHIS, TN-MS-AR (FHA|USDA|VA) | 3 | $19,235,000 | $6,411,667 | $7,846 | 3.00% |
| LAFAYETTE-WEST LAFAYETTE, IN (FHA|USDA|VA) | 4 | $19,150,000 | $4,787,500 | $1,108 | 3.29% |
| PORTLAND-VANCOUVER-HILLSBORO, OR-WA (FHA|USDA|VA) | 10 | $19,100,000 | $1,910,000 | $6,206 | 2.81% |
| Outside of Metro Areas | 59 | $17,675,000 | $299,576 | $3,293 | 2.97% |
| LUBBOCK, TX (FHA|USDA|VA) | 1 | $16,375,000 | $16,375,000 | $0 | 3.25% |
| RIVERSIDE-SAN BERNARDINO-ONTARIO, CA (FHA|USDA|VA) | 51 | $16,175,000 | $317,157 | $3,895 | 2.70% |
| ALBANY, GA (FHA|USDA|VA) | 3 | $15,815,000 | $5,271,667 | $0 | 4.13% |
| BOWLING GREEN, KY (FHA|USDA|VA) | 3 | $15,655,000 | $5,218,333 | $7,907 | 3.63% |
| SACRAMENTO-ROSEVILLE-FOLSOM, CA (FHA|USDA|VA) | 26 | $15,610,000 | $600,385 | $4,090 | 2.73% |
| WATERTOWN-FORT DRUM, NY (FHA|USDA|VA) | 3 | $14,845,000 | $4,948,333 | $0 | 3.05% |
| KOKOMO, IN (FHA|USDA|VA) | 5 | $14,825,000 | $2,965,000 | $1,502 | 3.74% |
| CANTON-MASSILLON, OH (FHA|USDA|VA) | 61 | $14,655,000 | $240,246 | $3,037 | 2.91% |
| DAPHNE-FAIRHOPE-FOLEY, AL (FHA|USDA|VA) | 3 | $14,265,000 | $4,755,000 | $7,376 | 3.26% |
| KENNEWICK-RICHLAND, WA (FHA|USDA|VA) | 1 | $14,005,000 | $14,005,000 | $0 | 5.50% |
| Seattle-Tacoma-Bellevue, WA (FHA|USDA|VA) | 40 | $13,410,000 | $335,250 | $3,991 | 2.73% |
| HICKORY-LENOIR-MORGANTON, NC (FHA|USDA|VA) | 3 | $13,085,000 | $4,361,667 | $9,385 | 3.16% |
| OMAHA-COUNCIL BLUFFS, NE-IA (FHA|USDA|VA) | 5 | $12,975,000 | $2,595,000 | $2,450 | 3.13% |
| PHOENIX-MESA-CHANDLER, AZ (FHA|USDA|VA) | 43 | $12,565,000 | $292,209 | $4,840 | 2.77% |
| NEW ORLEANS-METAIRIE, LA (FHA|USDA|VA) | 53 | $12,505,000 | $235,943 | $5,629 | 2.79% |
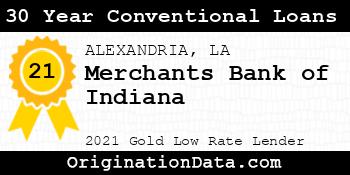
| ALEXANDRIA, LA (FHA|USDA|VA) | 49 | $12,235,000 | $249,694 | $3,676 | 2.65% |
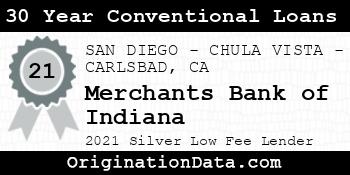
| SAN DIEGO-CHULA VISTA-CARLSBAD, CA (FHA|USDA|VA) | 33 | $12,095,000 | $366,515 | $3,560 | 2.83% |
| Marion, IN (FHA|USDA|VA) | 4 | $11,680,000 | $2,920,000 | $0 | 3.72% |
| LOUISVILLE, KY (FHA|USDA|VA) | 5 | $11,035,000 | $2,207,000 | $6,100 | 3.18% |
| PITTSBURGH, PA (FHA|USDA|VA) | 37 | $10,985,000 | $296,892 | $4,542 | 3.03% |
| MICHIGAN CITY-LA PORTE, IN (FHA|USDA|VA) | 2 | $10,720,000 | $5,360,000 | $6,834 | 2.83% |
| Philadelphia-Camden-Wilmington, PA-NJ-DE-MD (FHA|USDA|VA) | 7 | $10,345,000 | $1,477,857 | $4,153 | 2.98% |
| JACKSONVILLE, FL (FHA|USDA|VA) | 5 | $10,145,000 | $2,029,000 | $3,061 | 3.23% |
| GULFPORT-BILOXI, MS (FHA|USDA|VA) | 3 | $9,405,000 | $3,135,000 | $3,520 | 2.54% |
| ORLANDO-KISSIMMEE-SANFORD, FL (FHA|USDA|VA) | 30 | $9,380,000 | $312,667 | $4,055 | 2.54% |
| IOWA CITY, IA (FHA|USDA|VA) | 1 | $9,075,000 | $9,075,000 | $0 | 3.50% |
| COLUMBIA, MO (FHA|USDA|VA) | 2 | $8,650,000 | $4,325,000 | $2,008 | 3.06% |
| BROWNSVILLE-HARLINGEN, TX (FHA|USDA|VA) | 1 | $8,405,000 | $8,405,000 | $0 | 3.50% |
| Detroit-Warren-Dearborn, MI (FHA|USDA|VA) | 11 | $8,235,000 | $748,636 | $6,016 | 2.99% |
| SIOUX FALLS, SD (FHA|USDA|VA) | 2 | $7,200,000 | $3,600,000 | $0 | 3.75% |
| VIRGINIA BEACH-NORFOLK-NEWPORT NEWS, VA-NC (FHA|USDA|VA) | 4 | $7,190,000 | $1,797,500 | $5,291 | 2.71% |
| MUNCIE, IN (FHA|USDA|VA) | 6 | $6,950,000 | $1,158,333 | $2,515 | 3.18% |
| DENVER-AURORA-LAKEWOOD, CO (FHA|USDA|VA) | 18 | $6,330,000 | $351,667 | $5,228 | 2.78% |
| BECKLEY, WV (FHA|USDA|VA) | 2 | $6,130,000 | $3,065,000 | $0 | 3.25% |
| SAN JOSE-SUNNYVALE-SANTA CLARA, CA (FHA|USDA|VA) | 13 | $5,785,000 | $445,000 | $4,813 | 2.49% |
| OXNARD-THOUSAND OAKS-VENTURA, CA (FHA|USDA|VA) | 14 | $4,770,000 | $340,714 | $3,698 | 2.72% |
| WORCESTER, MA-CT (FHA|USDA|VA) | 14 | $4,680,000 | $334,286 | $3,090 | 2.72% |
| MONROE, LA (FHA|USDA|VA) | 18 | $4,470,000 | $248,333 | $4,360 | 2.74% |
| LAKE CHARLES, LA (FHA|USDA|VA) | 16 | $4,450,000 | $278,125 | $5,202 | 2.77% |
| DAYTON-KETTERING, OH (FHA|USDA|VA) | 22 | $4,260,000 | $193,636 | $3,227 | 3.26% |
| SANTA MARIA-SANTA BARBARA, CA (FHA|USDA|VA) | 10 | $4,040,000 | $404,000 | $3,328 | 2.56% |
| LONGVIEW, TX (FHA|USDA|VA) | 1 | $4,035,000 | $4,035,000 | $0 | 3.25% |
| MINNEAPOLIS-ST. PAUL-BLOOMINGTON, MN-WI (FHA|USDA|VA) | 15 | $3,905,000 | $260,333 | $4,995 | 2.66% |
| AKRON, OH (FHA|USDA|VA) | 19 | $3,625,000 | $190,789 | $3,383 | 2.78% |
| SYRACUSE, NY (FHA|USDA|VA) | 2 | $3,410,000 | $1,705,000 | $0 | 3.63% |
| CRESTVIEW-FORT WALTON BEACH-DESTIN, FL (FHA|USDA|VA) | 1 | $3,375,000 | $3,375,000 | $0 | 3.55% |
| LEXINGTON-FAYETTE, KY (FHA|USDA|VA) | 3 | $2,975,000 | $991,667 | $3,358 | 3.46% |
| GREENVILLE-ANDERSON, SC (FHA|USDA|VA) | 4 | $2,890,000 | $722,500 | $5,421 | 2.92% |
| Salem, OH (FHA|USDA|VA) | 22 | $2,830,000 | $128,636 | $3,130 | 2.82% |
| CAPE CORAL-FORT MYERS, FL (FHA|USDA|VA) | 8 | $2,770,000 | $346,250 | $3,725 | 2.73% |
| VALLEJO, CA (FHA|USDA|VA) | 9 | $2,715,000 | $301,667 | $3,110 | 2.74% |
| KANSAS CITY, MO-KS (FHA|USDA|VA) | 3 | $2,535,000 | $845,000 | $3,331 | 2.96% |
| YOUNGSTOWN-WARREN-BOARDMAN, OH-PA (FHA|USDA|VA) | 14 | $2,500,000 | $178,571 | $3,302 | 2.88% |
| MADISON, WI (FHA|USDA|VA) | 11 | $2,435,000 | $221,364 | $1,879 | 2.83% |
| STOCKTON, CA (FHA|USDA|VA) | 8 | $2,350,000 | $293,750 | $3,258 | 2.95% |
| NASHVILLE-DAVIDSON-MURFREESBORO-FRANKLIN, TN (FHA|USDA|VA) | 6 | $2,340,000 | $390,000 | $6,547 | 2.73% |
| Warsaw, IN (FHA|USDA|VA) | 6 | $2,320,000 | $386,667 | $2,250 | 2.79% |
| BOISE CITY, ID (FHA|USDA|VA) | 7 | $2,305,000 | $329,286 | $5,338 | 2.66% |
| BALTIMORE-COLUMBIA-TOWSON, MD (FHA|USDA|VA) | 6 | $2,010,000 | $335,000 | $5,623 | 2.81% |
| BARNSTABLE TOWN, MA (FHA|USDA|VA) | 5 | $1,995,000 | $399,000 | $3,566 | 3.00% |
| NAPLES-MARCO ISLAND, FL (FHA|USDA|VA) | 6 | $1,880,000 | $313,333 | $3,805 | 2.90% |
| SANTA ROSA-PETALUMA, CA (FHA|USDA|VA) | 4 | $1,820,000 | $455,000 | $2,981 | 2.75% |
| SAN LUIS OBISPO-PASO ROBLES, CA (FHA|USDA|VA) | 5 | $1,695,000 | $339,000 | $3,544 | 2.68% |
| NORWICH-NEW LONDON, CT (FHA|USDA|VA) | 5 | $1,635,000 | $327,000 | $3,105 | 2.58% |
| NAPA, CA (FHA|USDA|VA) | 3 | $1,585,000 | $528,333 | $4,058 | 2.83% |
| BATON ROUGE, LA (FHA|USDA|VA) | 5 | $1,585,000 | $317,000 | $6,269 | 2.58% |
| COLORADO SPRINGS, CO (FHA|USDA|VA) | 6 | $1,520,000 | $253,333 | $6,011 | 2.69% |
| SALINAS, CA (FHA|USDA|VA) | 4 | $1,500,000 | $375,000 | $3,367 | 2.53% |
| MODESTO, CA (FHA|USDA|VA) | 4 | $1,470,000 | $367,500 | $4,166 | 2.78% |
| Richmond, IN (FHA|USDA|VA) | 15 | $1,455,000 | $97,000 | $1,432 | 3.58% |
| COLUMBUS, IN (FHA|USDA|VA) | 4 | $1,390,000 | $347,500 | $2,321 | 2.88% |
| OCEAN CITY, NJ (FHA|USDA|VA) | 3 | $1,375,000 | $458,333 | $4,464 | 2.63% |
| FORT COLLINS, CO (FHA|USDA|VA) | 4 | $1,320,000 | $330,000 | $3,570 | 2.81% |
| WEIRTON-STEUBENVILLE, WV-OH (FHA|USDA|VA) | 11 | $1,315,000 | $119,545 | $3,191 | 2.70% |
| SANTA CRUZ-WATSONVILLE, CA (FHA|USDA|VA) | 4 | $1,310,000 | $327,500 | $3,975 | 2.50% |
| Breckenridge, CO (FHA|USDA|VA) | 2 | $1,300,000 | $650,000 | $0 | 3.00% |
| ALBUQUERQUE, NM (FHA|USDA|VA) | 4 | $1,290,000 | $322,500 | $4,527 | 2.94% |
| Logansport, IN (FHA|USDA|VA) | 1 | $1,225,000 | $1,225,000 | $0 | 3.25% |
| REDDING, CA (FHA|USDA|VA) | 4 | $1,180,000 | $295,000 | $2,939 | 2.88% |
| CLEVELAND-ELYRIA, OH (FHA|USDA|VA) | 7 | $1,175,000 | $167,857 | $5,319 | 2.89% |
| North Port-Sarasota-Bradenton, FL (FHA|USDA|VA) | 3 | $1,125,000 | $375,000 | $3,838 | 3.13% |
| BAKERSFIELD, CA (FHA|USDA|VA) | 4 | $1,060,000 | $265,000 | $3,434 | 2.59% |
| BRIDGEPORT-STAMFORD-NORWALK, CT (FHA|USDA|VA) | 2 | $1,040,000 | $520,000 | $3,685 | 2.75% |
| RALEIGH-CARY, NC (FHA|USDA|VA) | 3 | $1,015,000 | $338,333 | $3,467 | 2.29% |
| NEW HAVEN-MILFORD, CT (FHA|USDA|VA) | 3 | $965,000 | $321,667 | $6,152 | 2.83% |
| Edwards, CO (FHA|USDA|VA) | 3 | $965,000 | $321,667 | $12,195 | 2.63% |
| Truckee-Grass Valley, CA (FHA|USDA|VA) | 3 | $955,000 | $318,333 | $3,479 | 2.79% |
| CHARLESTON-NORTH CHARLESTON, SC (FHA|USDA|VA) | 5 | $945,000 | $189,000 | $7,421 | 2.85% |
| COLUMBIA, SC (FHA|USDA|VA) | 2 | $860,000 | $430,000 | $6,374 | 2.63% |
| TUCSON, AZ (FHA|USDA|VA) | 3 | $825,000 | $275,000 | $3,746 | 2.83% |
| DURHAM-CHAPEL HILL, NC (FHA|USDA|VA) | 3 | $735,000 | $245,000 | $6,903 | 2.58% |
| PORTLAND-SOUTH PORTLAND, ME (FHA|USDA|VA) | 2 | $730,000 | $365,000 | $4,936 | 2.31% |
| MYRTLE BEACH-CONWAY-NORTH MYRTLE BEACH, SC-NC (FHA|USDA|VA) | 2 | $710,000 | $355,000 | $5,732 | 2.81% |
| DeRidder, LA (FHA|USDA|VA) | 3 | $705,000 | $235,000 | $5,649 | 3.13% |
| AUSTIN-ROUND ROCK-GEORGETOWN, TX (FHA|USDA|VA) | 4 | $680,000 | $170,000 | $8,479 | 2.97% |
| JANESVILLE-BELOIT, WI (FHA|USDA|VA) | 3 | $675,000 | $225,000 | $873 | 3.21% |
| PUNTA GORDA, FL (FHA|USDA|VA) | 2 | $670,000 | $335,000 | $3,976 | 2.69% |
| WINCHESTER, VA-WV (FHA|USDA|VA) | 2 | $610,000 | $305,000 | $6,420 | 3.00% |
| PENSACOLA-FERRY PASS-BRENT, FL (FHA|USDA|VA) | 2 | $610,000 | $305,000 | $4,406 | 2.94% |
| Brainerd, MN (FHA|USDA|VA) | 1 | $595,000 | $595,000 | $3,914 | 3.00% |
| EL CENTRO, CA (FHA|USDA|VA) | 2 | $460,000 | $230,000 | $6,702 | 2.88% |
| YUBA CITY, CA (FHA|USDA|VA) | 2 | $440,000 | $220,000 | $5,839 | 3.00% |
| TOLEDO, OH (FHA|USDA|VA) | 1 | $425,000 | $425,000 | $6,258 | 2.88% |
| Jackson, WY-ID (FHA|USDA|VA) | 1 | $425,000 | $425,000 | $4,512 | 2.75% |
| Albertville, AL (FHA|USDA|VA) | 1 | $425,000 | $425,000 | $6,779 | 2.25% |
| LAFAYETTE, LA (FHA|USDA|VA) | 2 | $400,000 | $200,000 | $4,188 | 2.75% |
| BIRMINGHAM-HOOVER, AL (FHA|USDA|VA) | 2 | $400,000 | $200,000 | $4,731 | 2.44% |
| FRESNO, CA (FHA|USDA|VA) | 2 | $400,000 | $200,000 | $2,966 | 2.69% |
| Watertown-Fort Atkinson, WI (FHA|USDA|VA) | 2 | $390,000 | $195,000 | $1,310 | 2.88% |
| HAMMOND, LA (FHA|USDA|VA) | 2 | $390,000 | $195,000 | $5,528 | 2.50% |
| SPOKANE-SPOKANE VALLEY, WA (FHA|USDA|VA) | 1 | $385,000 | $385,000 | $3,166 | 2.38% |
| MONROE, MI (FHA|USDA|VA) | 1 | $375,000 | $375,000 | $10,984 | 2.88% |
| BISMARCK, ND (FHA|USDA|VA) | 1 | $375,000 | $375,000 | $7,057 | 2.50% |
| CORVALLIS, OR (FHA|USDA|VA) | 2 | $370,000 | $185,000 | $9,587 | 2.88% |
| Jennings, LA (FHA|USDA|VA) | 1 | $365,000 | $365,000 | $4,563 | 3.25% |
| Opelousas, LA (FHA|USDA|VA) | 1 | $355,000 | $355,000 | $3,332 | 3.25% |
| Farmington, MO (FHA|USDA|VA) | 1 | $335,000 | $335,000 | $1,041 | 2.63% |
| MONTGOMERY, AL (FHA|USDA|VA) | 1 | $335,000 | $335,000 | $11,381 | 3.13% |
| PALM BAY-MELBOURNE-TITUSVILLE, FL (FHA|USDA|VA) | 2 | $330,000 | $165,000 | $2,575 | 2.56% |
| SPRINGFIELD, OH (FHA|USDA|VA) | 2 | $330,000 | $165,000 | $3,128 | 3.75% |
| Greenville, OH (FHA|USDA|VA) | 2 | $330,000 | $165,000 | $0 | 4.25% |
| YAKIMA, WA (FHA|USDA|VA) | 1 | $325,000 | $325,000 | $2,174 | 3.00% |
| Nogales, AZ (FHA|USDA|VA) | 1 | $305,000 | $305,000 | $4,710 | 2.50% |
| Brookings, OR (FHA|USDA|VA) | 1 | $305,000 | $305,000 | $0 | 3.38% |
| AUGUSTA-RICHMOND COUNTY, GA-SC (FHA|USDA|VA) | 1 | $295,000 | $295,000 | $3,169 | 3.25% |
| FARMINGTON, NM (FHA|USDA|VA) | 1 | $295,000 | $295,000 | $7,352 | 2.13% |
| LANSING-EAST LANSING, MI (FHA|USDA|VA) | 1 | $295,000 | $295,000 | $3,930 | 2.50% |
| LYNCHBURG, VA (FHA|USDA|VA) | 1 | $295,000 | $295,000 | $5,072 | 2.88% |
| CAPE GIRARDEAU, MO-IL (FHA|USDA|VA) | 1 | $295,000 | $295,000 | $2,815 | 2.88% |
| BEND, OR (FHA|USDA|VA) | 1 | $295,000 | $295,000 | $11,044 | 2.63% |
| LAS CRUCES, NM (FHA|USDA|VA) | 1 | $285,000 | $285,000 | $7,467 | 2.63% |
| MADERA, CA (FHA|USDA|VA) | 1 | $285,000 | $285,000 | $3,106 | 2.00% |
| Natchitoches, LA (FHA|USDA|VA) | 1 | $285,000 | $285,000 | $3,292 | 2.50% |
| HUNTSVILLE, AL (FHA|USDA|VA) | 1 | $275,000 | $275,000 | $2,745 | 3.13% |
| BLACKSBURG-CHRISTIANSBURG, VA (FHA|USDA|VA) | 1 | $275,000 | $275,000 | $7,284 | 2.63% |
| New Philadelphia-Dover, OH (FHA|USDA|VA) | 1 | $275,000 | $275,000 | $4,050 | 2.99% |
| VISALIA, CA (FHA|USDA|VA) | 1 | $265,000 | $265,000 | $3,076 | 2.50% |
| CHATTANOOGA, TN-GA (FHA|USDA|VA) | 1 | $265,000 | $265,000 | $4,421 | 2.50% |
| Easton, MD (FHA|USDA|VA) | 1 | $265,000 | $265,000 | $3,590 | 2.63% |
| EUGENE-SPRINGFIELD, OR (FHA|USDA|VA) | 1 | $255,000 | $255,000 | $10,323 | 3.00% |
| Athens, OH (FHA|USDA|VA) | 1 | $255,000 | $255,000 | $3,245 | 3.00% |
| Alamogordo, NM (FHA|USDA|VA) | 1 | $255,000 | $255,000 | $7,913 | 2.88% |
| MANCHESTER-NASHUA, NH (FHA|USDA|VA) | 1 | $255,000 | $255,000 | $9,040 | 2.75% |
| ROCHESTER, MN (FHA|USDA|VA) | 1 | $255,000 | $255,000 | $4,711 | 2.75% |
| ATLANTIC CITY-HAMMONTON, NJ (FHA|USDA|VA) | 1 | $255,000 | $255,000 | $6,391 | 3.00% |
| HATTIESBURG, MS (FHA|USDA|VA) | 1 | $255,000 | $255,000 | $10,001 | 2.75% |
| WENATCHEE, WA (FHA|USDA|VA) | 1 | $255,000 | $255,000 | $2,097 | 3.13% |
| GREENSBORO-HIGH POINT, NC (FHA|USDA|VA) | 1 | $255,000 | $255,000 | $2,939 | 3.13% |
| KALAMAZOO-PORTAGE, MI (FHA|USDA|VA) | 1 | $255,000 | $255,000 | $3,035 | 3.00% |
| GRAND RAPIDS-KENTWOOD, MI (FHA|USDA|VA) | 1 | $255,000 | $255,000 | $4,713 | 2.88% |
| CHARLOTTESVILLE, VA (FHA|USDA|VA) | 1 | $255,000 | $255,000 | $8,118 | 2.38% |
| ANN ARBOR, MI (FHA|USDA|VA) | 1 | $255,000 | $255,000 | $7,910 | 2.88% |
| SANTA FE, NM (FHA|USDA|VA) | 1 | $245,000 | $245,000 | $3,786 | 2.50% |
| HARRISONBURG, VA (FHA|USDA|VA) | 1 | $245,000 | $245,000 | $2,836 | 3.25% |
| SALEM, OR (FHA|USDA|VA) | 1 | $245,000 | $245,000 | $11,533 | 2.75% |
| HILTON HEAD ISLAND-BLUFFTON, SC (FHA|USDA|VA) | 1 | $245,000 | $245,000 | $6,476 | 2.38% |
| EAST STROUDSBURG, PA (FHA|USDA|VA) | 1 | $245,000 | $245,000 | $4,105 | 2.63% |
| TUSCALOOSA, AL (FHA|USDA|VA) | 1 | $245,000 | $245,000 | $2,814 | 3.13% |
| LAKELAND-WINTER HAVEN, FL (FHA|USDA|VA) | 1 | $245,000 | $245,000 | $4,279 | 3.75% |
| TRENTON-PRINCETON, NJ (FHA|USDA|VA) | 1 | $245,000 | $245,000 | $8,062 | 2.63% |
| Picayune, MS (FHA|USDA|VA) | 1 | $235,000 | $235,000 | $8,123 | 2.50% |
| HUNTINGTON-ASHLAND, WV-KY-OH (FHA|USDA|VA) | 1 | $235,000 | $235,000 | $3,426 | 3.25% |
| Stillwater, OK (FHA|USDA|VA) | 1 | $235,000 | $235,000 | $6,033 | 2.63% |
| VINELAND-BRIDGETON, NJ (FHA|USDA|VA) | 1 | $235,000 | $235,000 | $4,696 | 2.50% |
| Eureka-Arcata, CA (FHA|USDA|VA) | 1 | $235,000 | $235,000 | $2,981 | 2.88% |
| Arkadelphia, AR (FHA|USDA|VA) | 1 | $235,000 | $235,000 | $10,811 | 2.75% |
| New Castle, IN (FHA|USDA|VA) | 1 | $235,000 | $235,000 | $1,520 | 3.25% |
| MILWAUKEE-WAUKESHA, WI (FHA|USDA|VA) | 1 | $225,000 | $225,000 | $4,737 | 2.75% |
| LEWISTON-AUBURN, ME (FHA|USDA|VA) | 1 | $225,000 | $225,000 | $5,971 | 2.25% |
| GRAND JUNCTION, CO (FHA|USDA|VA) | 1 | $215,000 | $215,000 | $8,676 | 2.25% |
| HINESVILLE, GA (FHA|USDA|VA) | 1 | $215,000 | $215,000 | $8,848 | 2.25% |
| MORGANTOWN, WV (FHA|USDA|VA) | 1 | $215,000 | $215,000 | $2,180 | 2.75% |
| Albemarle, NC (FHA|USDA|VA) | 1 | $215,000 | $215,000 | $7,800 | 2.25% |
| Meridian, MS (FHA|USDA|VA) | 1 | $215,000 | $215,000 | $4,630 | 2.25% |
| LAKE HAVASU CITY-KINGMAN, AZ (FHA|USDA|VA) | 1 | $215,000 | $215,000 | $7,370 | 2.50% |
| Holland, MI (FHA|USDA|VA) | 1 | $215,000 | $215,000 | $4,395 | 2.50% |
| ANCHORAGE, AK (FHA|USDA|VA) | 1 | $205,000 | $205,000 | $9,597 | 2.00% |
| Wooster, OH (FHA|USDA|VA) | 1 | $205,000 | $205,000 | $5,731 | 2.75% |
| Astoria, OR (FHA|USDA|VA) | 1 | $185,000 | $185,000 | $7,084 | 2.50% |
| SHREVEPORT-BOSSIER CITY, LA (FHA|USDA|VA) | 1 | $175,000 | $175,000 | $2,423 | 2.75% |
| ST. CLOUD, MN (FHA|USDA|VA) | 1 | $175,000 | $175,000 | $1,038 | 2.25% |
| ROCKFORD, IL (FHA|USDA|VA) | 1 | $165,000 | $165,000 | $5,653 | 2.88% |
| Jasper, IN (FHA|USDA|VA) | 1 | $165,000 | $165,000 | $1,930 | 3.50% |
| Mount Vernon, OH (FHA|USDA|VA) | 1 | $155,000 | $155,000 | $2,584 | 3.00% |
| PANAMA CITY, FL (FHA|USDA|VA) | 1 | $145,000 | $145,000 | $2,590 | 3.25% |
| North Wilkesboro, NC (FHA|USDA|VA) | 1 | $145,000 | $145,000 | $2,762 | 2.63% |
| SALISBURY, MD-DE (FHA|USDA|VA) | 1 | $135,000 | $135,000 | $2,150 | 2.88% |
| MCALLEN-EDINBURG-MISSION, TX (FHA|USDA|VA) | 1 | $135,000 | $135,000 | $3,679 | 2.75% |
| WICHITA, KS (FHA|USDA|VA) | 1 | $125,000 | $125,000 | $4,160 | 2.38% |
| New Castle, PA (FHA|USDA|VA) | 1 | $125,000 | $125,000 | $3,258 | 2.88% |
| LINCOLN, NE (FHA|USDA|VA) | 1 | $105,000 | $105,000 | $3,864 | 2.25% |
| FOND DU LAC, WI (FHA|USDA|VA) | 1 | $105,000 | $105,000 | $3,700 | 2.88% |
| DAVENPORT-MOLINE-ROCK ISLAND, IA-IL (FHA|USDA|VA) | 1 | $95,000 | $95,000 | $1,002 | 2.50% |
| Rochelle, IL (FHA|USDA|VA) | 1 | $95,000 | $95,000 | $3,548 | 3.25% |
| Frankfort, IN (FHA|USDA|VA) | 1 | $85,000 | $85,000 | $1,379 | 2.75% |
| Wabash, IN (FHA|USDA|VA) | 1 | $85,000 | $85,000 | $1,509 | 3.13% |
| Bedford, IN (FHA|USDA|VA) | 1 | $85,000 | $85,000 | $2,534 | 3.00% |
| Angola, IN (FHA|USDA|VA) | 1 | $65,000 | $65,000 | $1,498 | 2.75% |
Similar Lenders
We use machine learning to identify the top lenders compared against Merchants Bank of Indiana based on their rates and fees, along with other useful metrics. A lower similarity rank signals a stronger match.
Similarity Rank: 45
Similarity Rank: 87
Similarity Rank: 108
Similarity Rank: 144
Similarity Rank: 153
Similarity Rank: 156
Similarity Rank: 246
Similarity Rank: 252
Similarity Rank: 256
Similarity Rank: 264
Product Mix
| Loan Type | Originations | Total Value | Avg. Loan | Avg. Fees | Avg. Rate |
|---|---|---|---|---|---|
| Conventional | 3,576 | $2,784,030,000 | $778,532 | $3,122 | 2.84% |
| FHA | 26 | $5,090,000 | $195,769 | $5,673 | 2.89% |
For 2021, Merchants Bank Of Indiana's most frequently originated type of loan was Conventional, with 3,576 originations. Their 2nd most popular type was FHA, with 26 originations.
Loan Reason
For 2021, Merchants Bank Of Indiana's most frequently cited loan purpose was Refi, with 1,812 originations. The 2nd most popular reason was Home Purchase, with 952 originations.
Loan Duration/Length
For 2021, Merchants Bank Of Indiana's most frequently cited loan duration was 30 Year, with 2,271 originations. The 2nd most popular length was 15 Year, with 723 originations.
Origination Fees/Closing Costs
Merchants Bank Of Indiana's average total fees were $3,293, while their most frequently occuring range of origination fees (closing costs) were in the $1k-2k bucket, with 1,478 originations.
Interest Rates
During 2021, Merchants Bank Of Indiana's average interest rate for loans was 2.97%, while their most frequently originated rate bucket for loans was 2.5-3%, with 1,804 originations.
Loan Sizing
2021 saw Merchants Bank Of Indiana place emphasis on $200k-400k loans with 1,818 originations, totaling $516,630,000 in origination value.
Applicant Income
Merchants Bank Of Indiana lent most frequently to those with incomes in the $100k-150k range, with 894 originations. The second most popular income band? $150k-250k, with 730 originations.
Applicant Debt to Income Ratio
Merchants Bank Of Indiana lent most frequently to those with DTI ratios of 20-30%, with 974 originations. The next most common DTI ratio? 30-36%, with 604 originations.
Ethnicity Mix
Approval Rates
Total approvals of all applications98.34%
Merchants Bank Of Indiana has an exceptionally high approval rate. They either target their audience very well or may have lax underwriting protocols.
Pick Rate
Approvals leading to origination94.28%
Merchants Bank Of Indiana has an average pick rate.
Points and Fees
| Points | Originations | Total Value | Average Loan |
|---|---|---|---|
| NA | 3,602 | $2,789,120,000 | $774,325 |
Occupancy Type Mix
| Dwelling Type | Originations | Total Value | Average Loan |
|---|---|---|---|
| 3,602 | $2,789,120,000 | $774,325 |
LTV Distribution
Complaints
| Bank Name | Product | Issue | 2021 CPFB Complaints | % of Total Issues |
|---|---|---|---|---|
| Merchants and Medical Credit Corporation, Inc. | Conventional home mortgage | Struggling to pay mortgage | 1 | 100.0% |
Bank Details
Branches
| Bank Name | Branch | Branch Type | Deposits (000's) |
|---|---|---|---|
| Merchants Bank of Indiana | 701 E Main St Richmond, IN 47374 | Full Service B&M | $873,345 |
| Merchants Bank of Indiana | 7375 South Us Highway 27 Lynn, IN 47355 | Full Service B&M | $26,494 |
| Merchants Bank of Indiana | 11590 North Meridian Street Carmel, IN 46032 | Full Service B&M | $1,131,786 |
| Merchants Bank of Indiana | 3737 East 96th Street Indianapolis, IN 46240 | Full Service B&M | $670,085 |
| Merchants Bank of Indiana | 410 Monon Blvd. Carmel, IN 46032 | Full Service B&M | $5,144,079 |
| Merchants Bank of Indiana | 6880 South Arba Pike Lynn, IN 47355 | Full Service B&M | $9,997 |
For 2021, Merchants Bank Of Indiana had 6 branches.
Yearly Performance Overview
Bank Income
| Item | Value (in 000's) |
|---|---|
| Total interest income | $303,023 |
| Net interest income | $274,118 |
| Total noninterest income | $155,116 |
| Gross Fiduciary activities income | $0 |
| Service charges on deposit accounts | $359 |
| Trading account gains and fees | $0 |
| Additional Noninterest Income | $154,757 |
| Pre-tax net operating income | $304,087 |
| Securities gains (or losses, -) | $0 |
| Income before extraordinary items | $226,430 |
| Discontinued Operations (Extraordinary gains, net) | $0 |
| Net income of bank and minority interests | $226,430 |
| Minority interest net income | $0 |
| Net income | $226,430 |
| Sale, conversion, retirement of capital stock, net | $0 |
| Net operating income | $226,430 |
Merchants Bank Of Indiana's gross interest income from loans was $303,023,000.
Merchants Bank Of Indiana's net interest income from loans was $274,118,000.
Merchants Bank Of Indiana's fee based income from loans was $359,000.
Merchants Bank Of Indiana's net income from loans was $226,430,000.
Bank Expenses
| Item | Value (in 000's) |
|---|---|
| Total interest expense | $28,905 |
| Provision for credit losses | $4,833 |
| Total noninterest expense | $120,314 |
| Salaries and employee benefits | $83,183 |
| Premises and equipment expense | $6,878 |
| Additional noninterest expense | $30,253 |
| Applicable income taxes | $77,657 |
| Net charge-offs | $2,072 |
| Cash dividends | $33,447 |
Merchants Bank Of Indiana's interest expense for loans was $28,905,000.
Merchants Bank Of Indiana's payroll and benefits expense were $83,183,000.
Merchants Bank Of Indiana's property, plant and equipment expenses $6,878,000.
Loan Performance
| Type of Loan | % of Loans Noncurrent (30+ days, end of period snapshot) |
|---|---|
| All loans | 0.0% |
| Real Estate loans | 0.0% |
| Construction & Land Development loans | 0.0% |
| Nonfarm, nonresidential loans | 0.0% |
| Multifamily residential loans | 0.0% |
| 1-4 family residential loans | 0.0% |
| HELOC loans | 0.0% |
| All other family | 0.0% |
| Commercial & industrial loans | 0.0% |
| Personal loans | 0.0% |
| Credit card loans | 0.0% |
| Other individual loans | 0.0% |
| Auto loans | 0.0% |
| Other consumer loans | 0.0% |
| Unsecured commercial real estate loans | 0.0% |
Deposits
| Type | Value (in 000's) |
|---|---|
| Total deposits | $8,795,024 |
| Deposits held in domestic offices | $8,795,024 |
| Deposits by Individuals, partnerships, and corporations | $7,234,860 |
| Deposits by U.S. Government | $0 |
| Deposits by States and political subdivisions in the U.S. | $1,536,461 |
| Deposits by Commercial banks and other depository institutions in U.S. | $23,702 |
| Deposits by Banks in foreign countries | $0 |
| Deposits by Foreign governments and official institutions | $0 |
| Transaction accounts | $4,902,956 |
| Demand deposits | $4,720,802 |
| Nontransaction accounts | $3,892,067 |
| Money market deposit accounts (MMDAs) | $2,548,106 |
| Other savings deposits (excluding MMDAs) | $213,266 |
| Total time deposits | $1,130,697 |
| Total time and savings deposits | $4,074,221 |
| Noninterest-bearing deposits | $636,153 |
| Interest-bearing deposits | $8,158,871 |
| Retail deposits | $6,256,661 |
| IRAs and Keogh plan accounts | $645 |
| Brokered deposits | $2,129,780 |
| Deposits held in foreign offices | $0 |
Assets
| Asset | Value (in 000's) |
|---|---|
| Total Assets | $10,994,199 |
| Cash & Balances due from depository institutions | $1,028,974 |
| Interest-bearing balances | $1,016,523 |
| Total securities | $301,878 |
| Federal funds sold & reverse repurchase | $5,888 |
| Net loans and leases | $9,394,168 |
| Loan and leases loss allowance | $29,560 |
| Trading account assets | $0 |
| Bank premises and fixed assets | $28,575 |
| Other real estate owned | $0 |
| Goodwill and other intangibles | $119,002 |
| All other assets | $115,714 |
Liabilities
| Liabilities | Value (in 000's) |
|---|---|
| Total liabilities and capital | $10,994,199 |
| Total Liabilities | $9,897,172 |
| Total deposits | $8,795,024 |
| Interest-bearing deposits | $8,158,871 |
| Deposits held in domestic offices | $8,795,024 |
| % insured (estimated) | $68 |
| Federal funds purchased and repurchase agreements | $0 |
| Trading liabilities | $0 |
| Other borrowed funds | $1,010,778 |
| Subordinated debt | $0 |
| All other liabilities | $91,370 |
Issued Loan Types
| Type | Value (in 000's) |
|---|---|
| Net loans and leases | $9,394,168 |
| Loan and leases loss allowance | $29,560 |
| Total loans and leases (domestic) | $9,423,728 |
| All real estate loans | $4,847,879 |
| Real estate loans in domestic offices | $4,847,879 |
| Construction and development loans | $655,050 |
| Residential 1-4 family construction | $4,963 |
| Other construction, all land development and other land | $650,087 |
| Loans secured by nonfarm nonresidential properties | $919,246 |
| Nonfarm nonresidential secured by owner-occupied properties | $83,027 |
| Commercial real estate & other non-farm, non-residential | $836,219 |
| Multifamily residential real estate | $2,370,439 |
| 1-4 family residential loans | $867,633 |
| Farmland loans | $35,511 |
| Loans held in foreign offices | $0 |
| Farm loans | $22,839 |
| Commercial and industrial loans | $562,244 |
| To non-U.S. addressees | $0 |
| Loans to individuals | $4,200 |
| Credit card loans | $0 |
| Related Plans | $3,356 |
| Consumer Auto Loans | $640 |
| Other loans to individuals | $204 |
| All other loans & leases | $3,986,566 |
| Loans to foreign governments and official institutions | $0 |
| Other loans | $3,936,566 |
| Loans to depository institutions and acceptances of other banks | $50,000 |
| Loans not secured by real estate | $333,877 |
| Loans secured by real estate to non-U.S. addressees | $0 |
| Restructured Loans & leases | $4,059 |
| Non 1-4 family restructured loans & leases | $4,059 |
| Total loans and leases (foreign) | $0 |
Merchants Bank of Indiana had $9,394,168,000 of loans outstanding in 2021. $4,847,879,000 of loans were in real estate loans. $655,050,000 of loans were in development loans. $2,370,439,000 of loans were in multifamily mortgage loans. $867,633,000 of loans were in 1-4 family mortgage loans. $22,839,000 of loans were in farm loans. $0 of loans were in credit card loans. $640,000 of loans were in the auto loan category.
Small Business Loans
| Categorization | # of Loans in Category | $ amount of loans (in 000's) | Average $/loan |
|---|---|---|---|
| Nonfarm, nonresidential loans - <$1MM | 151 | $28,555 | $189,106 |
| Nonfarm, nonresidential loans - <$100k | 64 | $2,297 | $35,891 |
| Nonfarm, nonresidential loans - $100-250k | 24 | $3,288 | $137,000 |
| Nonfarm, nonresidential loans - $250k-1MM | 63 | $22,970 | $364,603 |
| Commercial & Industrial, US addressed loans - <$1MM | 347 | $40,423 | $116,493 |
| Commercial & Industrial, US addressed loans - <$100k | 161 | $4,850 | $30,124 |
| Commercial & Industrial, US addressed loans - $100-250k | 75 | $6,720 | $89,600 |
| Commercial & Industrial, US addressed loans - $250k-1MM | 111 | $28,853 | $259,937 |
| Farmland loans - <$1MM | 193 | $17,861 | $92,544 |
| Farmland loans - <$100k | 55 | $2,005 | $36,455 |
| Farmland loans - $100-250k | 84 | $7,013 | $83,488 |
| Farmland loans - $250k-1MM | 54 | $8,843 | $163,759 |
| Agriculture operations loans - <$1MM | 278 | $16,285 | $58,579 |
| Agriculture operations loans - <$100k | 197 | $4,986 | $25,310 |
| Agriculture operations loans - $100-250k | 58 | $5,447 | $93,914 |
| Agriculture operations loans - $250k-1MM | 23 | $5,852 | $254,435 |