Bokf Mortgage Rates, Fees & Info
Tulsa, OKLEI: FU7RSW4CQQY98A2O7J66
Tax ID: 73-0780382
Latest/2024 | 2023 Data | 2022 Data | 2021 Data | 2020 Data | 2019 Data | 2018 Data
Jump to:
Mortgage Data
Bank Data
Review & Overview
Bokf is a small mortgage company specializing in Home Purchase loans. Bokf has a high proportion of conventional loans. They have an average proportion of FHA loans. They have a low ratio of USDA loans. Their top markets by origination volume include: Tulsa, Oklahoma City, Dallas, Albuquerque, and Denver among others. We have data for 433 markets. (Some data included below & more in-depth data is available with an active subscription.)Bokf has an average approval rate when compared to the average across all lenders. They have a below average pick rate when compared to similar lenders. Bokf is typically a low fee lender. (We use the term "fees" to include things like closing costs and other costs incurred by borrowers-- whether they are paid out of pocket or rolled into the loan.) They typically have about average rates.
We show data for every lender and do not change our ratings-- even if an organization is a paid advertiser. Our consensus data does have lag, but it is highly correlated to a lender's rates & fees relative to their markets. This means that if a bank is a low fee/rate lender the past-- chances are they are still one today. Our SimulatedRates™ use advanced statistical techniques to forecast different rates based on a lender's historical data.
Mortgage seekers: Choose your metro area here to explore the lowest fee & rate lenders.
Mortgage professionals: We have various tools to make your lives easier. Contact us to see how we can help with your market research, analytics or advertising needs.
SimulatedRates™Mortgage Type |
Simulated Rate | Simulation Date |
|---|---|---|
| Home Equity Line of Credit (HELOC) | 6.72% | 8/3/25 |
| 30 Year Conventional Purchase | 6.91% | 8/3/25 |
| 30 Year Conventional Refi | 6.83% | 8/3/25 |
| 30 Year Cash-out Refi | 7.39% | 8/3/25 |
| 30 Year FHA Purchase | 7.42% | 8/3/25 |
| 30 Year FHA Refi | 7.38% | 8/3/25 |
| 30 Year VA Purchase | 6.63% | 8/3/25 |
| 30 Year VA Refi | 6.09% | 8/3/25 |
| 30 Year USDA Purchase | 7.10% | 8/3/25 |
| 15 Year Conventional Purchase | 6.21% | 8/3/25 |
| 15 Year Conventional Refi | 7.88% | 8/3/25 |
| 15 Year Cash-out Refi | 7.88% | 8/3/25 |
| 15 Year FHA Purchase | 6.00% | 8/3/25 |
| These are simulated rates generated by our proprietary machine learning models. These are not guaranteed by the bank. They are our estimates based on a lender's past behaviors combined with current market conditions. Contact an individual lender for their actual rates. Our models use fixed rate terms for conforming loans, 700+ FICO, 10% down for FHA and 20% for conventional. These are based on consensus, historical data-- not advertised promotional rates. | ||
Bokf Mortgage Calculator
Your Estimates
Estimated Loan Payment: Update the calculator values and click calculate payment!
This is not an official calculator from Bokf. It uses our SimulatedRate™
technology, basic math and reasonable assumptions to calculate mortgage payments derived from our simulations and your inputs.
The default purchase price is the median sales price across the US for 2022Q4, per FRED.
Originations
12,505Origination Dollar Volume (All Markets)
$2,819,735,000Employee count
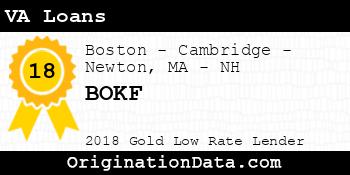
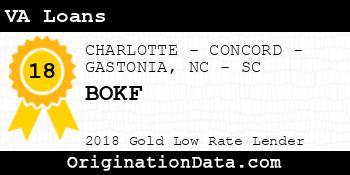
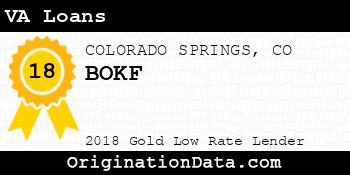
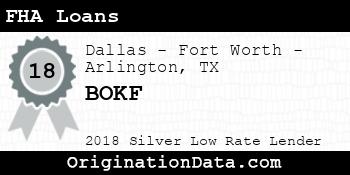
4,612 Show all (59) awardsBOKF - 2018
BOKF is a 2018 , due to their low .
For 2018, less than of lenders were eligible for this award.
Work for BOKF?
Use this award on your own site. Either save and use the images below, or pass the provided image embed code to your development team.
Top Markets
Zoom/scroll map to see bank's per metro statistics. Subscribers can configure state/metro/county granularity, assorted fields and quantity of results. This map shows top 10 markets in the map viewport, as defined by descending origination volume.
| Market | Originations | Total Value | Average Loan | Average Fees | Average Rate |
|---|---|---|---|---|---|
| TULSA, OK (FHA|USDA|VA) | 2,108 | $313,730,000 | $148,828 | $4,436 | 5.10% |
| OKLAHOMA CITY, OK (FHA|USDA|VA) | 1,458 | $240,160,000 | $164,719 | $3,730 | 5.13% |
| Dallas-Fort Worth-Arlington, TX (FHA|USDA|VA) | 944 | $239,720,000 | $253,941 | $5,514 | 4.93% |
| ALBUQUERQUE, NM (FHA|USDA|VA) | 1,393 | $218,285,000 | $156,701 | $3,737 | 5.07% |
| DENVER-AURORA-LAKEWOOD, CO (FHA|USDA|VA) | 709 | $202,545,000 | $285,677 | $4,417 | 4.89% |
| KANSAS CITY, MO-KS (FHA|USDA|VA) | 565 | $136,095,000 | $240,876 | $3,413 | 4.83% |
| HOUSTON-THE WOODLANDS-SUGAR LAND, TX (FHA|USDA|VA) | 431 | $128,285,000 | $297,645 | $5,126 | 4.96% |
| PHOENIX-MESA-CHANDLER, AZ (FHA|USDA|VA) | 368 | $100,250,000 | $272,418 | $4,270 | 4.96% |
| Breckenridge, CO (FHA|USDA|VA) | 212 | $80,790,000 | $381,085 | $3,427 | 4.80% |
| Outside of Metro Areas | 347 | $65,025,000 | $187,392 | $4,149 | 4.76% |
| FAYETTEVILLE-SPRINGDALE-ROGERS, AR (FHA|USDA|VA) | 375 | $60,675,000 | $161,800 | $3,830 | 4.77% |
| Washington-Arlington-Alexandria, DC-VA-MD-WV (FHA|USDA|VA) | 127 | $57,775,000 | $454,921 | $6,179 | 4.11% |
| AUSTIN-ROUND ROCK-GEORGETOWN, TX (FHA|USDA|VA) | 184 | $54,240,000 | $294,783 | $5,491 | 4.64% |
| SAN ANTONIO-NEW BRAUNFELS, TX (FHA|USDA|VA) | 196 | $42,880,000 | $218,776 | $5,824 | 4.57% |
| Los Angeles-Long Beach-Anaheim, CA (FHA|USDA|VA) | 65 | $32,605,000 | $501,615 | $6,253 | 4.23% |
| New York-Newark-Jersey City, NY-NJ-PA (FHA|USDA|VA) | 62 | $27,040,000 | $436,129 | $7,333 | 4.40% |
| SAN DIEGO-CHULA VISTA-CARLSBAD, CA (FHA|USDA|VA) | 45 | $24,215,000 | $538,111 | $6,709 | 4.15% |
| Seattle-Tacoma-Bellevue, WA (FHA|USDA|VA) | 44 | $21,070,000 | $478,864 | $5,161 | 4.36% |
| BALTIMORE-COLUMBIA-TOWSON, MD (FHA|USDA|VA) | 57 | $20,275,000 | $355,702 | $6,945 | 4.17% |
| GREELEY, CO (FHA|USDA|VA) | 77 | $19,895,000 | $258,377 | $4,357 | 4.70% |
| BOULDER, CO (FHA|USDA|VA) | 45 | $19,125,000 | $425,000 | $3,326 | 4.88% |
| FORT COLLINS, CO (FHA|USDA|VA) | 64 | $19,020,000 | $297,188 | $3,580 | 4.78% |
| COLORADO SPRINGS, CO (FHA|USDA|VA) | 60 | $18,860,000 | $314,333 | $5,610 | 4.34% |
| SANTA FE, NM (FHA|USDA|VA) | 78 | $17,290,000 | $221,667 | $4,875 | 4.95% |
| ATLANTA-SANDY SPRINGS-ALPHARETTA, GA (FHA|USDA|VA) | 56 | $17,260,000 | $308,214 | $5,722 | 4.14% |
| RIVERSIDE-SAN BERNARDINO-ONTARIO, CA (FHA|USDA|VA) | 48 | $16,970,000 | $353,542 | $6,481 | 4.30% |
| Boston-Cambridge-Newton, MA-NH (FHA|USDA|VA) | 38 | $16,790,000 | $441,842 | $6,530 | 4.19% |
| Miami-Fort Lauderdale-Pompano Beach, FL (FHA|USDA|VA) | 38 | $12,750,000 | $335,526 | $7,789 | 4.24% |
| WICHITA, KS (FHA|USDA|VA) | 90 | $12,380,000 | $137,556 | $3,607 | 4.81% |
| VIRGINIA BEACH-NORFOLK-NEWPORT NEWS, VA-NC (FHA|USDA|VA) | 37 | $11,985,000 | $323,919 | $6,724 | 4.04% |
| SAN JOSE-SUNNYVALE-SANTA CLARA, CA (FHA|USDA|VA) | 22 | $11,680,000 | $530,909 | $5,727 | 4.54% |
| JACKSONVILLE, FL (FHA|USDA|VA) | 38 | $11,170,000 | $293,947 | $6,308 | 4.10% |
| San Francisco-Oakland-Berkeley, CA (FHA|USDA|VA) | 21 | $11,165,000 | $531,667 | $6,432 | 4.32% |
| BOISE CITY, ID (FHA|USDA|VA) | 36 | $11,090,000 | $308,056 | $5,446 | 4.26% |
| ENID, OK (FHA|USDA|VA) | 107 | $10,945,000 | $102,290 | $4,395 | 5.06% |
| Glenwood Springs, CO (FHA|USDA|VA) | 7 | $10,515,000 | $1,502,143 | $3,567 | 4.50% |
| LAS VEGAS-HENDERSON-PARADISE, NV (FHA|USDA|VA) | 33 | $9,905,000 | $300,152 | $3,490 | 4.50% |
| SACRAMENTO-ROSEVILLE-FOLSOM, CA (FHA|USDA|VA) | 24 | $9,530,000 | $397,083 | $6,494 | 4.27% |
| TAMPA-ST. PETERSBURG-CLEARWATER, FL (FHA|USDA|VA) | 35 | $9,275,000 | $265,000 | $5,244 | 4.43% |
| OXNARD-THOUSAND OAKS-VENTURA, CA (FHA|USDA|VA) | 19 | $9,175,000 | $482,895 | $5,561 | 4.18% |
| CHARLOTTE-CONCORD-GASTONIA, NC-SC (FHA|USDA|VA) | 27 | $8,805,000 | $326,111 | $5,820 | 4.27% |
| NASHVILLE-DAVIDSON-MURFREESBORO-FRANKLIN, TN (FHA|USDA|VA) | 28 | $8,750,000 | $312,500 | $4,545 | 4.29% |
| PORTLAND-VANCOUVER-HILLSBORO, OR-WA (FHA|USDA|VA) | 25 | $8,115,000 | $324,600 | $6,522 | 4.25% |
| KILLEEN-TEMPLE, TX (FHA|USDA|VA) | 36 | $7,850,000 | $218,056 | $5,209 | 4.66% |
| RALEIGH-CARY, NC (FHA|USDA|VA) | 21 | $7,035,000 | $335,000 | $4,792 | 4.01% |
| Edwards, CO (FHA|USDA|VA) | 7 | $7,025,000 | $1,003,571 | $5,880 | 4.54% |
| Chicago-Naperville-Elgin, IL-IN-WI (FHA|USDA|VA) | 20 | $6,590,000 | $329,500 | $6,541 | 4.31% |
| Muskogee, OK (FHA|USDA|VA) | 62 | $6,470,000 | $104,355 | $4,118 | 5.05% |
| MINNEAPOLIS-ST. PAUL-BLOOMINGTON, MN-WI (FHA|USDA|VA) | 21 | $6,355,000 | $302,619 | $4,870 | 4.30% |
| LITTLE ROCK-NORTH LITTLE ROCK-CONWAY, AR (FHA|USDA|VA) | 33 | $6,285,000 | $190,455 | $3,873 | 4.65% |
| TOPEKA, KS (FHA|USDA|VA) | 46 | $6,060,000 | $131,739 | $3,610 | 4.68% |
| ST. LOUIS, MO-IL (FHA|USDA|VA) | 24 | $5,620,000 | $234,167 | $4,157 | 4.54% |
| URBAN HONOLULU, HI (FHA|USDA|VA) | 8 | $5,160,000 | $645,000 | $15,650 | 3.94% |
| Philadelphia-Camden-Wilmington, PA-NJ-DE-MD (FHA|USDA|VA) | 16 | $5,060,000 | $316,250 | $7,128 | 4.21% |
| BREMERTON-SILVERDALE-PORT ORCHARD, WA (FHA|USDA|VA) | 10 | $5,020,000 | $502,000 | $6,817 | 3.81% |
| CHARLESTON-NORTH CHARLESTON, SC (FHA|USDA|VA) | 14 | $4,840,000 | $345,714 | $5,114 | 4.15% |
| PALM BAY-MELBOURNE-TITUSVILLE, FL (FHA|USDA|VA) | 12 | $4,770,000 | $397,500 | $9,024 | 4.52% |
| PORTLAND-SOUTH PORTLAND, ME (FHA|USDA|VA) | 4 | $4,770,000 | $1,192,500 | $4,679 | 4.44% |
| ORLANDO-KISSIMMEE-SANFORD, FL (FHA|USDA|VA) | 14 | $4,630,000 | $330,714 | $4,933 | 4.12% |
| Coffeyville, KS (FHA|USDA|VA) | 3 | $4,325,000 | $1,441,667 | $3,753 | 4.81% |
| PENSACOLA-FERRY PASS-BRENT, FL (FHA|USDA|VA) | 13 | $4,255,000 | $327,308 | $4,927 | 4.22% |
| SPRINGFIELD, MO (FHA|USDA|VA) | 29 | $4,235,000 | $146,034 | $3,495 | 4.64% |
| LOUISVILLE, KY (FHA|USDA|VA) | 11 | $4,235,000 | $385,000 | $3,739 | 4.07% |
| SIERRA VISTA-DOUGLAS, AZ (FHA|USDA|VA) | 3 | $4,125,000 | $1,375,000 | $5,008 | 4.19% |
| SALT LAKE CITY, UT (FHA|USDA|VA) | 10 | $4,090,000 | $409,000 | $5,186 | 4.50% |
| TUCSON, AZ (FHA|USDA|VA) | 22 | $4,060,000 | $184,545 | $4,960 | 4.76% |
| LAWTON, OK (FHA|USDA|VA) | 30 | $3,950,000 | $131,667 | $5,077 | 4.71% |
| Shawnee, OK (FHA|USDA|VA) | 28 | $3,950,000 | $141,071 | $3,536 | 4.99% |
| Bartlesville, OK (FHA|USDA|VA) | 41 | $3,885,000 | $94,756 | $5,184 | 5.36% |
| SAN LUIS OBISPO-PASO ROBLES, CA (FHA|USDA|VA) | 7 | $3,775,000 | $539,286 | $5,499 | 4.18% |
| LAS CRUCES, NM (FHA|USDA|VA) | 19 | $3,725,000 | $196,053 | $4,448 | 4.75% |
| PRESCOTT VALLEY-PRESCOTT, AZ (FHA|USDA|VA) | 14 | $3,610,000 | $257,857 | $4,375 | 4.51% |
| RENO, NV (FHA|USDA|VA) | 10 | $3,580,000 | $358,000 | $3,822 | 4.21% |
| SHERMAN-DENISON, TX (FHA|USDA|VA) | 30 | $3,520,000 | $117,333 | $4,980 | 5.08% |
| OGDEN-CLEARFIELD, UT (FHA|USDA|VA) | 10 | $3,420,000 | $342,000 | $4,886 | 4.40% |
| Detroit-Warren-Dearborn, MI (FHA|USDA|VA) | 12 | $3,390,000 | $282,500 | $5,367 | 4.46% |
| SANTA MARIA-SANTA BARBARA, CA (FHA|USDA|VA) | 5 | $3,345,000 | $669,000 | $11,954 | 3.95% |
| CINCINNATI, OH-KY-IN (FHA|USDA|VA) | 9 | $3,205,000 | $356,111 | $4,218 | 4.31% |
| BRIDGEPORT-STAMFORD-NORWALK, CT (FHA|USDA|VA) | 5 | $3,205,000 | $641,000 | $12,384 | 4.18% |
| Los Alamos, NM (FHA|USDA|VA) | 8 | $3,160,000 | $395,000 | $5,380 | 4.41% |
| Gallup, NM (FHA|USDA|VA) | 21 | $3,075,000 | $146,429 | $4,533 | 4.83% |
| HILTON HEAD ISLAND-BLUFFTON, SC (FHA|USDA|VA) | 9 | $3,025,000 | $336,111 | $6,447 | 4.01% |
| INDIANAPOLIS-CARMEL-ANDERSON, IN (FHA|USDA|VA) | 11 | $3,015,000 | $274,091 | $5,079 | 4.25% |
| Heber, UT (FHA|USDA|VA) | 1 | $2,985,000 | $2,985,000 | $2,007 | 4.88% |
| PROVIDENCE-WARWICK, RI-MA (FHA|USDA|VA) | 8 | $2,920,000 | $365,000 | $3,942 | 4.17% |
| Stillwater, OK (FHA|USDA|VA) | 18 | $2,830,000 | $157,222 | $5,233 | 4.88% |
| LUBBOCK, TX (FHA|USDA|VA) | 12 | $2,790,000 | $232,500 | $4,739 | 4.73% |
| McAlester, OK (FHA|USDA|VA) | 27 | $2,765,000 | $102,407 | $4,116 | 5.27% |
| CRESTVIEW-FORT WALTON BEACH-DESTIN, FL (FHA|USDA|VA) | 9 | $2,735,000 | $303,889 | $7,669 | 4.08% |
| ANCHORAGE, AK (FHA|USDA|VA) | 8 | $2,730,000 | $341,250 | $7,030 | 3.95% |
| EL PASO, TX (FHA|USDA|VA) | 14 | $2,540,000 | $181,429 | $4,115 | 4.67% |
| KNOXVILLE, TN (FHA|USDA|VA) | 7 | $2,535,000 | $362,143 | $6,162 | 4.04% |
| CORPUS CHRISTI, TX (FHA|USDA|VA) | 10 | $2,500,000 | $250,000 | $4,969 | 4.54% |
| PORT ST. LUCIE, FL (FHA|USDA|VA) | 9 | $2,495,000 | $277,222 | $4,894 | 4.39% |
| POUGHKEEPSIE-NEWBURGH-MIDDLETOWN, NY (FHA|USDA|VA) | 9 | $2,445,000 | $271,667 | $5,587 | 4.54% |
| DELTONA-DAYTONA BEACH-ORMOND BEACH, FL (FHA|USDA|VA) | 11 | $2,425,000 | $220,455 | $4,291 | 4.22% |
| CLARKSVILLE, TN-KY (FHA|USDA|VA) | 10 | $2,330,000 | $233,000 | $3,297 | 4.05% |
| MEDFORD, OR (FHA|USDA|VA) | 7 | $2,305,000 | $329,286 | $5,838 | 4.32% |
| North Port-Sarasota-Bradenton, FL (FHA|USDA|VA) | 6 | $2,230,000 | $371,667 | $7,146 | 4.29% |
| RICHMOND, VA (FHA|USDA|VA) | 8 | $2,230,000 | $278,750 | $4,189 | 4.27% |
| COLUMBUS, OH (FHA|USDA|VA) | 7 | $2,165,000 | $309,286 | $6,281 | 4.02% |
| WORCESTER, MA-CT (FHA|USDA|VA) | 7 | $2,105,000 | $300,714 | $6,416 | 4.20% |
| OMAHA-COUNCIL BLUFFS, NE-IA (FHA|USDA|VA) | 8 | $2,090,000 | $261,250 | $3,523 | 4.44% |
| Juneau, AK (FHA|USDA|VA) | 5 | $2,065,000 | $413,000 | $12,359 | 3.98% |
| AUGUSTA-RICHMOND COUNTY, GA-SC (FHA|USDA|VA) | 8 | $2,050,000 | $256,250 | $3,332 | 4.13% |
| GRAND JUNCTION, CO (FHA|USDA|VA) | 7 | $2,045,000 | $292,143 | $3,367 | 4.66% |
| FAYETTEVILLE, NC (FHA|USDA|VA) | 8 | $2,020,000 | $252,500 | $5,052 | 4.09% |
| Weatherford, OK (FHA|USDA|VA) | 7 | $2,005,000 | $286,429 | $4,022 | 4.79% |
| SALINAS, CA (FHA|USDA|VA) | 3 | $1,975,000 | $658,333 | $1,392 | 3.67% |
| HICKORY-LENOIR-MORGANTON, NC (FHA|USDA|VA) | 6 | $1,970,000 | $328,333 | $4,862 | 4.19% |
| OLYMPIA-LACEY-TUMWATER, WA (FHA|USDA|VA) | 6 | $1,970,000 | $328,333 | $6,815 | 3.94% |
| HAGERSTOWN-MARTINSBURG, MD-WV (FHA|USDA|VA) | 4 | $1,940,000 | $485,000 | $9,028 | 4.06% |
| Fort Morgan, CO (FHA|USDA|VA) | 9 | $1,935,000 | $215,000 | $4,436 | 4.94% |
| FRESNO, CA (FHA|USDA|VA) | 7 | $1,935,000 | $276,429 | $7,528 | 4.00% |
| MIDLAND, TX (FHA|USDA|VA) | 8 | $1,930,000 | $241,250 | $4,888 | 4.33% |
| ASHEVILLE, NC (FHA|USDA|VA) | 7 | $1,915,000 | $273,571 | $3,157 | 4.11% |
| SAVANNAH, GA (FHA|USDA|VA) | 8 | $1,890,000 | $236,250 | $5,918 | 4.09% |
| SALEM, OR (FHA|USDA|VA) | 6 | $1,880,000 | $313,333 | $8,278 | 3.71% |
| TYLER, TX (FHA|USDA|VA) | 5 | $1,845,000 | $369,000 | $3,589 | 5.03% |
| MEMPHIS, TN-MS-AR (FHA|USDA|VA) | 9 | $1,845,000 | $205,000 | $5,383 | 4.67% |
| PUEBLO, CO (FHA|USDA|VA) | 10 | $1,830,000 | $183,000 | $4,171 | 4.39% |
| BROWNSVILLE-HARLINGEN, TX (FHA|USDA|VA) | 2 | $1,820,000 | $910,000 | $6,549 | 4.81% |
| FORT SMITH, AR-OK (FHA|USDA|VA) | 10 | $1,770,000 | $177,000 | $3,465 | 5.18% |
| CHARLOTTESVILLE, VA (FHA|USDA|VA) | 5 | $1,725,000 | $345,000 | $3,731 | 4.18% |
| DAYTON-KETTERING, OH (FHA|USDA|VA) | 5 | $1,675,000 | $335,000 | $5,598 | 4.10% |
| SANTA ROSA-PETALUMA, CA (FHA|USDA|VA) | 4 | $1,670,000 | $417,500 | $3,699 | 4.19% |
| GREENVILLE-ANDERSON, SC (FHA|USDA|VA) | 7 | $1,665,000 | $237,857 | $4,408 | 4.43% |
| PANAMA CITY, FL (FHA|USDA|VA) | 6 | $1,660,000 | $276,667 | $6,082 | 4.23% |
| Española, NM (FHA|USDA|VA) | 7 | $1,655,000 | $236,429 | $5,140 | 5.02% |
| WINSTON-SALEM, NC (FHA|USDA|VA) | 6 | $1,640,000 | $273,333 | $5,151 | 3.96% |
| BAKERSFIELD, CA (FHA|USDA|VA) | 6 | $1,590,000 | $265,000 | $6,226 | 4.17% |
| PROVO-OREM, UT (FHA|USDA|VA) | 6 | $1,590,000 | $265,000 | $4,101 | 4.46% |
| MERCED, CA (FHA|USDA|VA) | 6 | $1,580,000 | $263,333 | $4,721 | 4.21% |
| Hobbs, NM (FHA|USDA|VA) | 10 | $1,560,000 | $156,000 | $3,871 | 4.84% |
| CAPE CORAL-FORT MYERS, FL (FHA|USDA|VA) | 7 | $1,545,000 | $220,714 | $4,188 | 4.66% |
| LAKE HAVASU CITY-KINGMAN, AZ (FHA|USDA|VA) | 5 | $1,545,000 | $309,000 | $6,199 | 3.95% |
| PITTSBURGH, PA (FHA|USDA|VA) | 4 | $1,530,000 | $382,500 | $10,376 | 4.28% |
| VALLEJO, CA (FHA|USDA|VA) | 4 | $1,510,000 | $377,500 | $4,599 | 4.22% |
| DAPHNE-FAIRHOPE-FOLEY, AL (FHA|USDA|VA) | 7 | $1,505,000 | $215,000 | $3,521 | 4.30% |
| NEW ORLEANS-METAIRIE, LA (FHA|USDA|VA) | 6 | $1,490,000 | $248,333 | $5,820 | 4.38% |
| Bozeman, MT (FHA|USDA|VA) | 3 | $1,485,000 | $495,000 | $8,866 | 4.21% |
| STOCKTON, CA (FHA|USDA|VA) | 4 | $1,470,000 | $367,500 | $3,484 | 4.50% |
| Lake City, FL (FHA|USDA|VA) | 5 | $1,455,000 | $291,000 | $3,261 | 4.33% |
| Warrensburg, MO (FHA|USDA|VA) | 10 | $1,440,000 | $144,000 | $3,578 | 4.73% |
| Tahlequah, OK (FHA|USDA|VA) | 10 | $1,430,000 | $143,000 | $5,421 | 4.95% |
| MADISON, WI (FHA|USDA|VA) | 4 | $1,420,000 | $355,000 | $6,418 | 3.94% |
| WACO, TX (FHA|USDA|VA) | 6 | $1,380,000 | $230,000 | $4,815 | 4.56% |
| FLAGSTAFF, AZ (FHA|USDA|VA) | 4 | $1,370,000 | $342,500 | $5,534 | 4.16% |
| Oak Harbor, WA (FHA|USDA|VA) | 4 | $1,370,000 | $342,500 | $6,963 | 4.06% |
| Granbury, TX (FHA|USDA|VA) | 4 | $1,370,000 | $342,500 | $2,564 | 4.72% |
| SPOKANE-SPOKANE VALLEY, WA (FHA|USDA|VA) | 4 | $1,360,000 | $340,000 | $3,247 | 4.16% |
| Mineral Wells, TX (FHA|USDA|VA) | 1 | $1,335,000 | $1,335,000 | $882 | 4.88% |
| DURHAM-CHAPEL HILL, NC (FHA|USDA|VA) | 4 | $1,330,000 | $332,500 | $6,406 | 4.53% |
| EUGENE-SPRINGFIELD, OR (FHA|USDA|VA) | 4 | $1,320,000 | $330,000 | $6,675 | 4.22% |
| BUFFALO-CHEEKTOWAGA, NY (FHA|USDA|VA) | 6 | $1,300,000 | $216,667 | $6,515 | 4.21% |
| YUBA CITY, CA (FHA|USDA|VA) | 4 | $1,290,000 | $322,500 | $8,749 | 3.88% |
| FARMINGTON, NM (FHA|USDA|VA) | 10 | $1,290,000 | $129,000 | $3,645 | 4.79% |
| SANTA CRUZ-WATSONVILLE, CA (FHA|USDA|VA) | 2 | $1,270,000 | $635,000 | $1,287 | 3.81% |
| NAPLES-MARCO ISLAND, FL (FHA|USDA|VA) | 4 | $1,240,000 | $310,000 | $9,136 | 4.63% |
| CHATTANOOGA, TN-GA (FHA|USDA|VA) | 4 | $1,190,000 | $297,500 | $4,252 | 4.31% |
| MODESTO, CA (FHA|USDA|VA) | 3 | $1,175,000 | $391,667 | $3,975 | 4.50% |
| LAWRENCE, KS (FHA|USDA|VA) | 6 | $1,160,000 | $193,333 | $3,226 | 4.77% |
| COLUMBIA, SC (FHA|USDA|VA) | 5 | $1,145,000 | $229,000 | $2,981 | 4.45% |
| Pinehurst-Southern Pines, NC (FHA|USDA|VA) | 3 | $1,145,000 | $381,667 | $12,107 | 4.29% |
| WINCHESTER, VA-WV (FHA|USDA|VA) | 3 | $1,105,000 | $368,333 | $7,655 | 4.04% |
| Hilo, HI (FHA|USDA|VA) | 3 | $1,095,000 | $365,000 | $7,525 | 4.17% |
| MYRTLE BEACH-CONWAY-NORTH MYRTLE BEACH, SC-NC (FHA|USDA|VA) | 6 | $1,070,000 | $178,333 | $3,767 | 4.67% |
| Kill Devil Hills, NC (FHA|USDA|VA) | 3 | $1,065,000 | $355,000 | $2,677 | 4.21% |
| REDDING, CA (FHA|USDA|VA) | 3 | $1,055,000 | $351,667 | $6,293 | 4.00% |
| BARNSTABLE TOWN, MA (FHA|USDA|VA) | 2 | $1,030,000 | $515,000 | $4,383 | 4.75% |
| Tullahoma-Manchester, TN (FHA|USDA|VA) | 9 | $1,005,000 | $111,667 | $3,864 | 5.18% |
| ALBANY-SCHENECTADY-TROY, NY (FHA|USDA|VA) | 4 | $990,000 | $247,500 | $3,280 | 4.72% |
| SHREVEPORT-BOSSIER CITY, LA (FHA|USDA|VA) | 4 | $980,000 | $245,000 | $6,285 | 4.09% |
| LAKELAND-WINTER HAVEN, FL (FHA|USDA|VA) | 4 | $980,000 | $245,000 | $6,703 | 4.31% |
| VISALIA, CA (FHA|USDA|VA) | 4 | $970,000 | $242,500 | $5,423 | 4.34% |
| BATON ROUGE, LA (FHA|USDA|VA) | 4 | $970,000 | $242,500 | $4,791 | 4.91% |
| GRAND RAPIDS-KENTWOOD, MI (FHA|USDA|VA) | 4 | $950,000 | $237,500 | $2,725 | 4.34% |
| LAKE CHARLES, LA (FHA|USDA|VA) | 4 | $930,000 | $232,500 | $8,975 | 4.16% |
| Hailey, ID (FHA|USDA|VA) | 3 | $925,000 | $308,333 | $7,677 | 4.04% |
| WARNER ROBINS, GA (FHA|USDA|VA) | 4 | $920,000 | $230,000 | $3,675 | 4.22% |
| St. Marys, GA (FHA|USDA|VA) | 3 | $915,000 | $305,000 | $6,341 | 4.29% |
| NORWICH-NEW LONDON, CT (FHA|USDA|VA) | 4 | $900,000 | $225,000 | $6,009 | 4.31% |
| RAPID CITY, SD (FHA|USDA|VA) | 4 | $890,000 | $222,500 | $2,704 | 4.69% |
| CALIFORNIA-LEXINGTON PARK, MD (FHA|USDA|VA) | 3 | $865,000 | $288,333 | $3,493 | 4.00% |
| YUMA, AZ (FHA|USDA|VA) | 4 | $860,000 | $215,000 | $4,505 | 4.78% |
| KENNEWICK-RICHLAND, WA (FHA|USDA|VA) | 3 | $855,000 | $285,000 | $4,933 | 4.33% |
| IDAHO FALLS, ID (FHA|USDA|VA) | 5 | $845,000 | $169,000 | $2,958 | 4.93% |
| HOT SPRINGS, AR (FHA|USDA|VA) | 6 | $840,000 | $140,000 | $2,685 | 4.67% |
| CLEVELAND-ELYRIA, OH (FHA|USDA|VA) | 3 | $835,000 | $278,333 | $6,623 | 4.29% |
| Roseburg, OR (FHA|USDA|VA) | 3 | $835,000 | $278,333 | $5,443 | 3.92% |
| HANFORD-CORCORAN, CA (FHA|USDA|VA) | 3 | $825,000 | $275,000 | $6,619 | 4.00% |
| FLINT, MI (FHA|USDA|VA) | 4 | $820,000 | $205,000 | $6,726 | 4.16% |
| GREENSBORO-HIGH POINT, NC (FHA|USDA|VA) | 3 | $815,000 | $271,667 | $4,700 | 4.38% |
| HARTFORD-EAST HARTFORD-MIDDLETOWN, CT (FHA|USDA|VA) | 3 | $815,000 | $271,667 | $4,238 | 4.54% |
| CHEYENNE, WY (FHA|USDA|VA) | 2 | $810,000 | $405,000 | $2,314 | 4.13% |
| Bonham, TX (FHA|USDA|VA) | 4 | $800,000 | $200,000 | $5,440 | 5.03% |
| Alamogordo, NM (FHA|USDA|VA) | 4 | $800,000 | $200,000 | $3,127 | 4.50% |
| HUNTINGTON-ASHLAND, WV-KY-OH (FHA|USDA|VA) | 4 | $790,000 | $197,500 | $2,983 | 4.41% |
| MANCHESTER-NASHUA, NH (FHA|USDA|VA) | 3 | $785,000 | $261,667 | $6,187 | 4.21% |
| KINGSPORT-BRISTOL, TN-VA (FHA|USDA|VA) | 3 | $785,000 | $261,667 | $3,058 | 3.88% |
| JACKSONVILLE, NC (FHA|USDA|VA) | 3 | $755,000 | $251,667 | $6,041 | 4.29% |
| Brainerd, MN (FHA|USDA|VA) | 2 | $750,000 | $375,000 | $11,337 | 4.06% |
| Ukiah, CA (FHA|USDA|VA) | 2 | $740,000 | $370,000 | $5,300 | 4.50% |
| SPRINGFIELD, MA (FHA|USDA|VA) | 3 | $735,000 | $245,000 | $5,132 | 4.50% |
| Ponca City, OK (FHA|USDA|VA) | 10 | $730,000 | $73,000 | $3,662 | 5.13% |
| ALLENTOWN-BETHLEHEM-EASTON, PA-NJ (FHA|USDA|VA) | 2 | $730,000 | $365,000 | $2,655 | 4.19% |
| SYRACUSE, NY (FHA|USDA|VA) | 4 | $730,000 | $182,500 | $5,101 | 4.34% |
| AMARILLO, TX (FHA|USDA|VA) | 5 | $715,000 | $143,000 | $4,185 | 4.35% |
| IOWA CITY, IA (FHA|USDA|VA) | 2 | $690,000 | $345,000 | $1,434 | 3.81% |
| SPARTANBURG, SC (FHA|USDA|VA) | 3 | $685,000 | $228,333 | $3,721 | 4.00% |
| GREAT FALLS, MT (FHA|USDA|VA) | 3 | $685,000 | $228,333 | $4,939 | 4.38% |
| OCEAN CITY, NJ (FHA|USDA|VA) | 1 | $685,000 | $685,000 | $5,436 | 4.88% |
| LEXINGTON-FAYETTE, KY (FHA|USDA|VA) | 2 | $680,000 | $340,000 | $5,069 | 3.94% |
| Rexburg, ID (FHA|USDA|VA) | 3 | $675,000 | $225,000 | $2,837 | 4.67% |
| Durango, CO (FHA|USDA|VA) | 3 | $665,000 | $221,667 | $3,565 | 4.75% |
| JEFFERSON CITY, MO (FHA|USDA|VA) | 3 | $655,000 | $218,333 | $4,119 | 4.33% |
| COLUMBUS, GA-AL (FHA|USDA|VA) | 3 | $655,000 | $218,333 | $3,782 | 4.21% |
| BIRMINGHAM-HOOVER, AL (FHA|USDA|VA) | 2 | $650,000 | $325,000 | $2,417 | 4.75% |
| MILWAUKEE-WAUKESHA, WI (FHA|USDA|VA) | 3 | $645,000 | $215,000 | $5,031 | 4.25% |
| BEND, OR (FHA|USDA|VA) | 2 | $640,000 | $320,000 | $10,074 | 4.19% |
| ALEXANDRIA, LA (FHA|USDA|VA) | 2 | $640,000 | $320,000 | $5,111 | 3.88% |
| COLLEGE STATION-BRYAN, TX (FHA|USDA|VA) | 3 | $635,000 | $211,667 | $7,044 | 4.13% |
| ST. JOSEPH, MO-KS (FHA|USDA|VA) | 2 | $630,000 | $315,000 | $6,296 | 4.44% |
| Carlsbad-Artesia, NM (FHA|USDA|VA) | 4 | $630,000 | $157,500 | $3,779 | 4.28% |
| Altus, OK (FHA|USDA|VA) | 4 | $620,000 | $155,000 | $4,218 | 4.97% |
| SAN ANGELO, TX (FHA|USDA|VA) | 3 | $605,000 | $201,667 | $6,072 | 4.83% |
| ODESSA, TX (FHA|USDA|VA) | 3 | $595,000 | $198,333 | $4,978 | 4.67% |
| Sandpoint, ID (FHA|USDA|VA) | 3 | $595,000 | $198,333 | $2,747 | 4.71% |
| FARGO, ND-MN (FHA|USDA|VA) | 2 | $590,000 | $295,000 | $6,595 | 4.00% |
| FORT WAYNE, IN (FHA|USDA|VA) | 2 | $580,000 | $290,000 | $6,062 | 4.25% |
| NEW HAVEN-MILFORD, CT (FHA|USDA|VA) | 2 | $580,000 | $290,000 | $7,748 | 4.06% |
| ROME, GA (FHA|USDA|VA) | 2 | $580,000 | $290,000 | $4,348 | 4.06% |
| BEAUMONT-PORT ARTHUR, TX (FHA|USDA|VA) | 4 | $580,000 | $145,000 | $4,599 | 4.88% |
| MISSOULA, MT (FHA|USDA|VA) | 2 | $580,000 | $290,000 | $6,950 | 4.63% |
| VICTORIA, TX (FHA|USDA|VA) | 2 | $570,000 | $285,000 | $4,917 | 4.00% |
| ELIZABETHTOWN-FORT KNOX, KY (FHA|USDA|VA) | 2 | $570,000 | $285,000 | $1,839 | 4.06% |
| ROCHESTER, NY (FHA|USDA|VA) | 2 | $560,000 | $280,000 | $9,139 | 4.50% |
| ROCKFORD, IL (FHA|USDA|VA) | 2 | $550,000 | $275,000 | $1,812 | 4.00% |
| HUNTSVILLE, AL (FHA|USDA|VA) | 3 | $545,000 | $181,667 | $4,453 | 4.58% |
| NILES, MI (FHA|USDA|VA) | 2 | $530,000 | $265,000 | $2,571 | 4.06% |
| Fernley, NV (FHA|USDA|VA) | 2 | $520,000 | $260,000 | $5,449 | 4.69% |
| RACINE, WI (FHA|USDA|VA) | 2 | $520,000 | $260,000 | $5,516 | 4.38% |
| Blackfoot, ID (FHA|USDA|VA) | 2 | $520,000 | $260,000 | $9,325 | 4.13% |
| Galesburg, IL (FHA|USDA|VA) | 1 | $515,000 | $515,000 | $15,081 | 3.38% |
| Steamboat Springs, CO (FHA|USDA|VA) | 2 | $510,000 | $255,000 | $3,958 | 4.81% |
| MOUNT VERNON-ANACORTES, WA (FHA|USDA|VA) | 1 | $505,000 | $505,000 | $3,354 | 3.50% |
| Kapaa, HI (FHA|USDA|VA) | 1 | $505,000 | $505,000 | $3,669 | 4.50% |
| JOPLIN, MO (FHA|USDA|VA) | 2 | $500,000 | $250,000 | $3,030 | 4.25% |
| HARRISBURG-CARLISLE, PA (FHA|USDA|VA) | 2 | $500,000 | $250,000 | $3,619 | 4.00% |
| ERIE, PA (FHA|USDA|VA) | 3 | $495,000 | $165,000 | $4,464 | 4.88% |
| Coos Bay, OR (FHA|USDA|VA) | 2 | $490,000 | $245,000 | $5,239 | 3.94% |
| COLUMBIA, MO (FHA|USDA|VA) | 2 | $480,000 | $240,000 | $3,406 | 4.19% |
| SUMTER, SC (FHA|USDA|VA) | 2 | $480,000 | $240,000 | $5,599 | 4.13% |
| Clovis, NM (FHA|USDA|VA) | 7 | $475,000 | $67,857 | $2,754 | 5.27% |
| SOUTH BEND-MISHAWAKA, IN-MI (FHA|USDA|VA) | 2 | $460,000 | $230,000 | $2,289 | 4.13% |
| TWIN FALLS, ID (FHA|USDA|VA) | 2 | $460,000 | $230,000 | $7,102 | 4.31% |
| Kalispell, MT (FHA|USDA|VA) | 1 | $455,000 | $455,000 | $3,392 | 4.75% |
| Milledgeville, GA (FHA|USDA|VA) | 1 | $455,000 | $455,000 | $18,963 | 3.75% |
| TALLAHASSEE, FL (FHA|USDA|VA) | 2 | $450,000 | $225,000 | $3,112 | 4.63% |
| Mountain Home, ID (FHA|USDA|VA) | 2 | $440,000 | $220,000 | $6,839 | 4.06% |
| LAFAYETTE, LA (FHA|USDA|VA) | 2 | $440,000 | $220,000 | $1,437 | 4.00% |
| JONESBORO, AR (FHA|USDA|VA) | 2 | $440,000 | $220,000 | $8,329 | 4.50% |
| MORRISTOWN, TN (FHA|USDA|VA) | 1 | $435,000 | $435,000 | $9,831 | 4.13% |
| Durant, OK (FHA|USDA|VA) | 3 | $435,000 | $145,000 | $3,482 | 4.83% |
| JOHNSON CITY, TN (FHA|USDA|VA) | 2 | $430,000 | $215,000 | $3,263 | 3.81% |
| EAST STROUDSBURG, PA (FHA|USDA|VA) | 2 | $430,000 | $215,000 | $1,793 | 4.00% |
| Sheridan, WY (FHA|USDA|VA) | 1 | $425,000 | $425,000 | $16,095 | 3.38% |
| Las Vegas, NM (FHA|USDA|VA) | 3 | $425,000 | $141,667 | $4,333 | 4.85% |
| Jacksonville, TX (FHA|USDA|VA) | 1 | $425,000 | $425,000 | $0 | 5.25% |
| LINCOLN, NE (FHA|USDA|VA) | 2 | $420,000 | $210,000 | $2,560 | 4.75% |
| LONGVIEW, TX (FHA|USDA|VA) | 3 | $415,000 | $138,333 | $4,921 | 5.25% |
| Moses Lake, WA (FHA|USDA|VA) | 1 | $415,000 | $415,000 | $2,186 | 3.88% |
| ABILENE, TX (FHA|USDA|VA) | 3 | $405,000 | $135,000 | $4,262 | 4.58% |
| Grants, NM (FHA|USDA|VA) | 6 | $400,000 | $66,667 | $3,753 | 5.13% |
| MANHATTAN, KS (FHA|USDA|VA) | 2 | $390,000 | $195,000 | $3,790 | 4.19% |
| Crescent City, CA (FHA|USDA|VA) | 1 | $385,000 | $385,000 | $6,323 | 4.25% |
| MOBILE, AL (FHA|USDA|VA) | 1 | $385,000 | $385,000 | $13,476 | 4.13% |
| ITHACA, NY (FHA|USDA|VA) | 2 | $380,000 | $190,000 | $6,530 | 4.31% |
| BILLINGS, MT (FHA|USDA|VA) | 1 | $375,000 | $375,000 | $9,730 | 3.25% |
| SALISBURY, MD-DE (FHA|USDA|VA) | 1 | $375,000 | $375,000 | $3,446 | 4.50% |
| Branson, MO (FHA|USDA|VA) | 2 | $370,000 | $185,000 | $2,434 | 4.06% |
| Sevierville, TN (FHA|USDA|VA) | 2 | $370,000 | $185,000 | $2,328 | 5.19% |
| Somerset, KY (FHA|USDA|VA) | 1 | $365,000 | $365,000 | $579 | 4.13% |
| Lebanon, NH-VT (FHA|USDA|VA) | 2 | $360,000 | $180,000 | $1,923 | 4.94% |
| HINESVILLE, GA (FHA|USDA|VA) | 2 | $360,000 | $180,000 | $3,099 | 4.50% |
| SHEBOYGAN, WI (FHA|USDA|VA) | 1 | $355,000 | $355,000 | $5,529 | 4.00% |
| NAPA, CA (FHA|USDA|VA) | 1 | $355,000 | $355,000 | $6,109 | 5.38% |
| Ottawa, KS (FHA|USDA|VA) | 3 | $355,000 | $118,333 | $3,173 | 4.46% |
| ROCHESTER, MN (FHA|USDA|VA) | 1 | $355,000 | $355,000 | $12,326 | 3.50% |
| Scottsboro, AL (FHA|USDA|VA) | 1 | $355,000 | $355,000 | $2,935 | 4.13% |
| Rolla, MO (FHA|USDA|VA) | 1 | $345,000 | $345,000 | $2,610 | 4.38% |
| Sebastian-Vero Beach, FL (FHA|USDA|VA) | 1 | $345,000 | $345,000 | $6,579 | 3.88% |
| Helena, MT (FHA|USDA|VA) | 1 | $345,000 | $345,000 | $3,989 | 4.50% |
| GRANTS PASS, OR (FHA|USDA|VA) | 1 | $345,000 | $345,000 | $2,003 | 3.75% |
| Fredericksburg, TX (FHA|USDA|VA) | 1 | $335,000 | $335,000 | $7,182 | 4.88% |
| GAINESVILLE, FL (FHA|USDA|VA) | 1 | $335,000 | $335,000 | $14,457 | 3.38% |
| BLOOMSBURG-BERWICK, PA (FHA|USDA|VA) | 1 | $335,000 | $335,000 | $9,971 | 3.38% |
| BLOOMINGTON, IN (FHA|USDA|VA) | 1 | $335,000 | $335,000 | $8,283 | 4.25% |
| Riverton, WY (FHA|USDA|VA) | 1 | $335,000 | $335,000 | $11,695 | 3.88% |
| Ardmore, OK (FHA|USDA|VA) | 2 | $330,000 | $165,000 | $3,563 | 4.88% |
| GOLDSBORO, NC (FHA|USDA|VA) | 1 | $325,000 | $325,000 | $12,834 | 3.25% |
| APPLETON, WI (FHA|USDA|VA) | 1 | $325,000 | $325,000 | $1,250 | 3.88% |
| Port Lavaca, TX (FHA|USDA|VA) | 1 | $315,000 | $315,000 | $3,819 | 4.88% |
| Shelton, WA (FHA|USDA|VA) | 1 | $315,000 | $315,000 | $2,596 | 4.88% |
| Lewisburg, TN (FHA|USDA|VA) | 1 | $315,000 | $315,000 | $1,998 | 4.25% |
| Holland, MI (FHA|USDA|VA) | 1 | $315,000 | $315,000 | $1,608 | 4.25% |
| Augusta-Waterville, ME (FHA|USDA|VA) | 1 | $315,000 | $315,000 | $4,271 | 4.13% |
| Key West, FL (FHA|USDA|VA) | 1 | $305,000 | $305,000 | $3,760 | 3.88% |
| ANN ARBOR, MI (FHA|USDA|VA) | 1 | $305,000 | $305,000 | $11,150 | 3.75% |
| Gardnerville Ranchos, NV (FHA|USDA|VA) | 1 | $305,000 | $305,000 | $4,994 | 3.88% |
| Outside of Metro Areas | 1 | $305,000 | $305,000 | $2,453 | 4.38% |
| BLOOMINGTON, IL (FHA|USDA|VA) | 1 | $305,000 | $305,000 | $3,598 | 3.88% |
| Traverse City, MI (FHA|USDA|VA) | 1 | $305,000 | $305,000 | $1,616 | 4.50% |
| Roswell, NM (FHA|USDA|VA) | 4 | $300,000 | $75,000 | $2,707 | 5.07% |
| VALDOSTA, GA (FHA|USDA|VA) | 2 | $300,000 | $150,000 | $3,203 | 4.00% |
| Jackson, OH (FHA|USDA|VA) | 1 | $295,000 | $295,000 | $12,795 | 3.88% |
| Eureka-Arcata, CA (FHA|USDA|VA) | 1 | $295,000 | $295,000 | $7,577 | 3.75% |
| KOKOMO, IN (FHA|USDA|VA) | 1 | $295,000 | $295,000 | $8,588 | 3.88% |
| AKRON, OH (FHA|USDA|VA) | 1 | $295,000 | $295,000 | $1,363 | 4.88% |
| Concord, NH (FHA|USDA|VA) | 1 | $295,000 | $295,000 | $2,993 | 4.00% |
| Cookeville, TN (FHA|USDA|VA) | 1 | $295,000 | $295,000 | $2,293 | 4.00% |
| Ruidoso, NM (FHA|USDA|VA) | 1 | $295,000 | $295,000 | $1,959 | 4.13% |
| Nacogdoches, TX (FHA|USDA|VA) | 2 | $290,000 | $145,000 | $4,601 | 5.19% |
| Sterling, CO (FHA|USDA|VA) | 1 | $285,000 | $285,000 | $3,254 | 3.88% |
| ATLANTIC CITY-HAMMONTON, NJ (FHA|USDA|VA) | 1 | $285,000 | $285,000 | $2,773 | 4.00% |
| WENATCHEE, WA (FHA|USDA|VA) | 1 | $285,000 | $285,000 | $2,143 | 5.38% |
| Hutchinson, KS (FHA|USDA|VA) | 1 | $285,000 | $285,000 | $10,121 | 4.13% |
| BOWLING GREEN, KY (FHA|USDA|VA) | 1 | $285,000 | $285,000 | $9,600 | 4.25% |
| WICHITA FALLS, TX (FHA|USDA|VA) | 1 | $285,000 | $285,000 | $0 | 5.75% |
| BISMARCK, ND (FHA|USDA|VA) | 1 | $285,000 | $285,000 | $8,559 | 4.00% |
| STAUNTON, VA (FHA|USDA|VA) | 1 | $275,000 | $275,000 | $2,037 | 4.00% |
| KINGSTON, NY (FHA|USDA|VA) | 1 | $275,000 | $275,000 | $1,931 | 3.75% |
| MONROE, LA (FHA|USDA|VA) | 1 | $275,000 | $275,000 | $10,205 | 3.50% |
| WATERTOWN-FORT DRUM, NY (FHA|USDA|VA) | 1 | $275,000 | $275,000 | $886 | 4.50% |
| Georgetown, SC (FHA|USDA|VA) | 1 | $275,000 | $275,000 | $11,118 | 4.00% |
| Sidney, OH (FHA|USDA|VA) | 1 | $275,000 | $275,000 | $5,331 | 4.13% |
| Winfield, KS (FHA|USDA|VA) | 2 | $270,000 | $135,000 | $7,696 | 5.00% |
| ALBANY, GA (FHA|USDA|VA) | 2 | $270,000 | $135,000 | $4,417 | 4.44% |
| Lebanon, MO (FHA|USDA|VA) | 4 | $270,000 | $67,500 | $3,345 | 4.97% |
| Show Low, AZ (FHA|USDA|VA) | 1 | $265,000 | $265,000 | $2,919 | 4.88% |
| Marion, NC (FHA|USDA|VA) | 1 | $265,000 | $265,000 | $1,304 | 4.00% |
| Paris, TX (FHA|USDA|VA) | 1 | $265,000 | $265,000 | $5,391 | 4.63% |
| Laconia, NH (FHA|USDA|VA) | 1 | $265,000 | $265,000 | $3,036 | 4.75% |
| Jefferson, GA (FHA|USDA|VA) | 1 | $265,000 | $265,000 | $4,955 | 4.25% |
| ROANOKE, VA (FHA|USDA|VA) | 1 | $265,000 | $265,000 | $1,598 | 4.50% |
| WAUSAU-WESTON, WI (FHA|USDA|VA) | 2 | $260,000 | $130,000 | $1,723 | 5.06% |
| FAIRBANKS, AK (FHA|USDA|VA) | 1 | $255,000 | $255,000 | $2,216 | 3.38% |
| MUSKEGON, MI (FHA|USDA|VA) | 1 | $255,000 | $255,000 | $8,768 | 4.13% |
| WALLA WALLA, WA (FHA|USDA|VA) | 1 | $255,000 | $255,000 | $7,824 | 4.00% |
| Sedalia, MO (FHA|USDA|VA) | 2 | $250,000 | $125,000 | $3,497 | 4.56% |
| GAINESVILLE, GA (FHA|USDA|VA) | 1 | $245,000 | $245,000 | $4,003 | 4.00% |
| CEDAR RAPIDS, IA (FHA|USDA|VA) | 1 | $245,000 | $245,000 | $678 | 4.50% |
| MICHIGAN CITY-LA PORTE, IN (FHA|USDA|VA) | 1 | $245,000 | $245,000 | $1,707 | 4.63% |
| Lawrenceburg, TN (FHA|USDA|VA) | 1 | $245,000 | $245,000 | $6,699 | 4.75% |
| Ozark, AL (FHA|USDA|VA) | 1 | $245,000 | $245,000 | $5,503 | 4.38% |
| Mount Sterling, KY (FHA|USDA|VA) | 1 | $245,000 | $245,000 | $5,376 | 3.75% |
| Corsicana, TX (FHA|USDA|VA) | 2 | $240,000 | $120,000 | $4,892 | 5.06% |
| MONTGOMERY, AL (FHA|USDA|VA) | 2 | $240,000 | $120,000 | $1,947 | 4.63% |
| Woodward, OK (FHA|USDA|VA) | 2 | $240,000 | $120,000 | $4,573 | 4.84% |
| Hudson, NY (FHA|USDA|VA) | 1 | $235,000 | $235,000 | $5,134 | 4.13% |
| DES MOINES-WEST DES MOINES, IA (FHA|USDA|VA) | 1 | $235,000 | $235,000 | $1,061 | 3.75% |
| Red Bluff, CA (FHA|USDA|VA) | 1 | $235,000 | $235,000 | $3,148 | 4.75% |
| Laramie, WY (FHA|USDA|VA) | 1 | $235,000 | $235,000 | $2,153 | 4.63% |
| Newport, OR (FHA|USDA|VA) | 1 | $235,000 | $235,000 | $3,709 | 4.88% |
| SCRANTON--WILKES-BARRE, PA (FHA|USDA|VA) | 1 | $225,000 | $225,000 | $3,160 | 4.88% |
| TRENTON-PRINCETON, NJ (FHA|USDA|VA) | 1 | $225,000 | $225,000 | $2,945 | 4.25% |
| Ottawa, IL (FHA|USDA|VA) | 1 | $225,000 | $225,000 | $915 | 4.50% |
| YORK-HANOVER, PA (FHA|USDA|VA) | 1 | $225,000 | $225,000 | $6,678 | 4.00% |
| Williston, ND (FHA|USDA|VA) | 1 | $225,000 | $225,000 | $9,408 | 4.25% |
| TOLEDO, OH (FHA|USDA|VA) | 2 | $220,000 | $110,000 | $4,202 | 4.56% |
| Mount Pleasant, MI (FHA|USDA|VA) | 1 | $215,000 | $215,000 | $6,189 | 5.00% |
| ATHENS-CLARKE COUNTY, GA (FHA|USDA|VA) | 1 | $215,000 | $215,000 | $2,070 | 4.63% |
| Montrose, CO (FHA|USDA|VA) | 1 | $215,000 | $215,000 | $3,130 | 4.63% |
| Meridian, MS (FHA|USDA|VA) | 1 | $215,000 | $215,000 | $5,009 | 3.75% |
| CHAMBERSBURG-WAYNESBORO, PA (FHA|USDA|VA) | 1 | $215,000 | $215,000 | $9,467 | 3.50% |
| Butte-Silver Bow, MT (FHA|USDA|VA) | 1 | $215,000 | $215,000 | $1,679 | 4.63% |
| MANSFIELD, OH (FHA|USDA|VA) | 1 | $215,000 | $215,000 | $450 | 3.75% |
| Emporia, KS (FHA|USDA|VA) | 2 | $210,000 | $105,000 | $3,904 | 4.69% |
| Big Spring, TX (FHA|USDA|VA) | 1 | $205,000 | $205,000 | $4,550 | 4.63% |
| Searcy, AR (FHA|USDA|VA) | 1 | $205,000 | $205,000 | $2,054 | 4.63% |
| ST. GEORGE, UT (FHA|USDA|VA) | 1 | $195,000 | $195,000 | $2,477 | 4.75% |
| Harrison, AR (FHA|USDA|VA) | 1 | $195,000 | $195,000 | $2,026 | 4.25% |
| Pierre, SD (FHA|USDA|VA) | 1 | $195,000 | $195,000 | $1,508 | 4.50% |
| CARBONDALE-MARION, IL (FHA|USDA|VA) | 1 | $195,000 | $195,000 | $9,679 | 4.50% |
| Fort Payne, AL (FHA|USDA|VA) | 1 | $195,000 | $195,000 | $1,801 | 4.25% |
| CANTON-MASSILLON, OH (FHA|USDA|VA) | 1 | $185,000 | $185,000 | $1,406 | 4.25% |
| Rock Springs, WY (FHA|USDA|VA) | 1 | $185,000 | $185,000 | $5,405 | 4.13% |
| Port Angeles, WA (FHA|USDA|VA) | 1 | $185,000 | $185,000 | $2,038 | 5.25% |
| GETTYSBURG, PA (FHA|USDA|VA) | 1 | $185,000 | $185,000 | $2,967 | 5.50% |
| Russellville, AR (FHA|USDA|VA) | 1 | $185,000 | $185,000 | $938 | 5.13% |
| SIOUX CITY, IA-NE-SD (FHA|USDA|VA) | 1 | $185,000 | $185,000 | $6,432 | 4.13% |
| Taos, NM (FHA|USDA|VA) | 1 | $185,000 | $185,000 | $2,295 | 4.63% |
| TERRE HAUTE, IN (FHA|USDA|VA) | 1 | $185,000 | $185,000 | $1,357 | 4.38% |
| PUNTA GORDA, FL (FHA|USDA|VA) | 1 | $185,000 | $185,000 | $8,392 | 4.13% |
| BURLINGTON, NC (FHA|USDA|VA) | 1 | $185,000 | $185,000 | $878 | 4.13% |
| Hereford, TX (FHA|USDA|VA) | 1 | $175,000 | $175,000 | $4,123 | 4.38% |
| Stephenville, TX (FHA|USDA|VA) | 1 | $175,000 | $175,000 | $3,929 | 4.00% |
| CHARLESTON, WV (FHA|USDA|VA) | 1 | $175,000 | $175,000 | $5,207 | 4.88% |
| HATTIESBURG, MS (FHA|USDA|VA) | 1 | $175,000 | $175,000 | $2,151 | 4.13% |
| Yankton, SD (FHA|USDA|VA) | 1 | $175,000 | $175,000 | $2,225 | 4.63% |
| Hillsdale, MI (FHA|USDA|VA) | 1 | $165,000 | $165,000 | $1,288 | 3.75% |
| Columbus, MS (FHA|USDA|VA) | 1 | $165,000 | $165,000 | $4,176 | 3.50% |
| Sterling, IL (FHA|USDA|VA) | 1 | $165,000 | $165,000 | $5,296 | 4.50% |
| Marietta, OH (FHA|USDA|VA) | 1 | $155,000 | $155,000 | $3,397 | 4.25% |
| Mayfield, KY (FHA|USDA|VA) | 1 | $155,000 | $155,000 | $4,862 | 3.75% |
| LOGAN, UT-ID (FHA|USDA|VA) | 1 | $155,000 | $155,000 | $2,893 | 4.88% |
| Elizabeth City, NC (FHA|USDA|VA) | 1 | $155,000 | $155,000 | $5,736 | 3.50% |
| Bainbridge, GA (FHA|USDA|VA) | 1 | $155,000 | $155,000 | $440 | 5.25% |
| YOUNGSTOWN-WARREN-BOARDMAN, OH-PA (FHA|USDA|VA) | 1 | $135,000 | $135,000 | $2,058 | 4.75% |
| READING, PA (FHA|USDA|VA) | 1 | $135,000 | $135,000 | $3,534 | 3.50% |
| FLORENCE, SC (FHA|USDA|VA) | 1 | $135,000 | $135,000 | $773 | 5.50% |
| GULFPORT-BILOXI, MS (FHA|USDA|VA) | 1 | $135,000 | $135,000 | $5,320 | 4.63% |
| MCALLEN-EDINBURG-MISSION, TX (FHA|USDA|VA) | 1 | $135,000 | $135,000 | $4,230 | 5.00% |
| DOTHAN, AL (FHA|USDA|VA) | 1 | $135,000 | $135,000 | $2,302 | 4.88% |
| SEBRING-AVON PARK, FL (FHA|USDA|VA) | 1 | $125,000 | $125,000 | $4,381 | 4.38% |
| Gainesville, TX (FHA|USDA|VA) | 1 | $125,000 | $125,000 | $4,108 | 4.63% |
| Adrian, MI (FHA|USDA|VA) | 1 | $125,000 | $125,000 | $1,484 | 3.88% |
| Starkville, MS (FHA|USDA|VA) | 1 | $125,000 | $125,000 | $1,712 | 4.13% |
| JACKSON, TN (FHA|USDA|VA) | 1 | $125,000 | $125,000 | $5,792 | 4.63% |
| Miami, OK (FHA|USDA|VA) | 3 | $125,000 | $41,667 | $4,572 | 5.17% |
| Greenwood, SC (FHA|USDA|VA) | 1 | $125,000 | $125,000 | $4,417 | 5.25% |
| LaGrange, GA-AL (FHA|USDA|VA) | 1 | $125,000 | $125,000 | $2,128 | 4.63% |
| Gloversville, NY (FHA|USDA|VA) | 1 | $125,000 | $125,000 | $3,771 | 4.88% |
| BINGHAMTON, NY (FHA|USDA|VA) | 1 | $115,000 | $115,000 | $2,091 | 5.75% |
| Hays, KS (FHA|USDA|VA) | 1 | $115,000 | $115,000 | $2,190 | 4.75% |
| Safford, AZ (FHA|USDA|VA) | 1 | $105,000 | $105,000 | $5,137 | 4.38% |
| New Ulm, MN (FHA|USDA|VA) | 1 | $95,000 | $95,000 | $1,232 | 3.38% |
| ELMIRA, NY (FHA|USDA|VA) | 1 | $85,000 | $85,000 | $4,251 | 5.13% |
| Levelland, TX (FHA|USDA|VA) | 1 | $85,000 | $85,000 | $4,957 | 5.25% |
| Liberal, KS (FHA|USDA|VA) | 2 | $80,000 | $40,000 | $2,553 | 6.18% |
| CAPE GIRARDEAU, MO-IL (FHA|USDA|VA) | 1 | $75,000 | $75,000 | $2,469 | 4.75% |
| Clinton, IA (FHA|USDA|VA) | 1 | $75,000 | $75,000 | $2,522 | 5.13% |
| Pearsall, TX (FHA|USDA|VA) | 1 | $35,000 | $35,000 | $0 | 6.30% |
Similar Lenders
We use machine learning to identify the top lenders compared against BOKF based on their rates and fees, along with other useful metrics. A lower similarity rank signals a stronger match.
Similarity Rank: 20
Similarity Rank: 40
Similarity Rank: 42
Similarity Rank: 55
Similarity Rank: 64
Similarity Rank: 64
Similarity Rank: 66
Similarity Rank: 84
Similarity Rank: 86
Similarity Rank: 88
Product Mix
For 2018, Bokf's most frequently originated type of loan was Conventional, with 7,448 originations. Their 2nd most popular type was HELOC, with 1,887 originations.
Loan Reason
For 2018, Bokf's most frequently cited loan purpose was Home Purchase, with 7,599 originations. The 2nd most popular reason was Cash Out Refi, with 1,852 originations.
Loan Duration/Length
For 2018, Bokf's most frequently cited loan duration was 30 Year, with 8,501 originations. The 2nd most popular length was Other, with 1,739 originations.
Origination Fees/Closing Costs
Bokf's average total fees were $4,705, while their most frequently occuring range of origination fees (closing costs) were in the $<1k bucket, with 4,536 originations.
Interest Rates
During 2018, Bokf's average interest rate for loans was 4.63%, while their most frequently originated rate bucket for loans was 4-5%, with 7,021 originations.
Loan Sizing
2018 saw Bokf place emphasis on $100k-200k loans with 3,882 originations, totaling $574,950,000 in origination value.
Applicant Income
Bokf lent most frequently to those with incomes in the $50k-75k range, with 2,697 originations. The second most popular income band? $100k-150k, with 2,531 originations.
Applicant Debt to Income Ratio
Bokf lent most frequently to those with DTI ratios of 20-30%, with 2,440 originations. The next most common DTI ratio? 30-36%, with 2,141 originations.
Ethnicity Mix
Approval Rates
Total approvals of all applications75.29%
Bokf has a below average approval rate.
Pick Rate
Approvals leading to origination84.13%
Bokf has a below average pick rate.
Points and Fees
| Points | Originations | Total Value | Average Loan |
|---|---|---|---|
| NA | 12,505 | $2,819,735,000 | $225,489 |
Occupancy Type Mix
LTV Distribution
Bank Details
Branches
| Bank Name | Branch | Branch Type | Deposits (000's) |
|---|---|---|---|
| BOKF, National Association | 1 Williams Center Tulsa, OK 74172 | Full Service Cyber Office | $32,018 |
| BOKF, National Association | 10026 W. San Juan Way Littleton, CO 80127 | Full Service Retail | $15,645 |
| BOKF, National Association | 10040 Coors-By-Pass, N.W. Albuquerque, NM 87114 | Full Service B&M | $61,401 |
| BOKF, National Association | 1011 Roberts Cut Off River Oaks, TX 76114 | Full Service B&M | $16,603 |
| BOKF, National Association | 102 West 6th Street, Suite 100 Larned, KS 67550 | Full Service B&M | $0 |
| BOKF, National Association | 1044 Main Street Kansas City, MO 64105 | Full Service B&M | $58,234 |
| BOKF, National Association | 10912 North Rockwell Avenue Oklahoma City, OK 73162 | Full Service B&M | $30,797 |
| BOKF, National Association | 1100 South Garth Brooks Boulevard Yukon, OK 73099 | Full Service B&M | $91,354 |
| BOKF, National Association | 11010 S Elm Street Jenks, OK 74037 | Full Service B&M | $27,818 |
| BOKF, National Association | 11111 East 81st Street Tulsa, OK 74133 | Full Service B&M | $90,015 |
| BOKF, National Association | 11225 College Blvd Overland Park, KS 66210 | Full Service B&M | $0 |
| BOKF, National Association | 11300 North May Avenue Oklahoma City, OK 73120 | Full Service B&M | $57,296 |
| BOKF, National Association | 1140 N York Street Muskogee, OK 74403 | Full Service B&M | $34,782 |
| BOKF, National Association | 11815 East 86th Street North Owasso, OK 74055 | Full Service B&M | $34,587 |
| BOKF, National Association | 11830 South Pennsylvania Avenue Oklahoma City, OK 73170 | Full Service B&M | $48,873 |
| BOKF, National Association | 12052 South Memorial Drive Bixby, OK 74008 | Full Service B&M | $62,657 |
| BOKF, National Association | 12112 Metcalf Avenue Overland Park, KS 66213 | Full Service B&M | $793,922 |
| BOKF, National Association | 12255 Westheimer Houston, TX 77077 | Full Service B&M | $34,979 |
| BOKF, National Association | 125 Southwest Blvd Kansas City, MO 64108 | Full Service B&M | $17,342 |
| BOKF, National Association | 12764 Memorial Drive Houston, TX 77024 | Full Service B&M | $37,233 |
| BOKF, National Association | 1301 Juan Tabo Boulevard, N.E. Albuquerque, NM 87112 | Full Service B&M | $78,096 |
| BOKF, National Association | 1303 South East Walton Boulevard Bentonville, AR 72712 | Full Service B&M | $9,021 |
| BOKF, National Association | 13230 West Little York Houston, TX 77041 | Full Service B&M | $29,767 |
| BOKF, National Association | 1325 North Kelly Avenue Edmond, OK 73003 | Full Service B&M | $39,591 |
| BOKF, National Association | 13600 N. Macarthur Boulevard Oklahoma City, OK 73142 | Full Service B&M | $72,141 |
| BOKF, National Association | 1400 East 15th Street Edmond, OK 73013 | Full Service B&M | $122,616 |
| BOKF, National Association | 1400 South Santa Fe Avenue Edmond, OK 73003 | Full Service B&M | $79,508 |
| BOKF, National Association | 14098 Nw Freeway Houston, TX 77040 | Full Service B&M | $48,417 |
| BOKF, National Association | 14501 East Alameda Aurora, CO 80012 | Full Service B&M | $20,674 |
| BOKF, National Association | 1500 Midwest Boulevard Midwest City, OK 73110 | Full Service B&M | $81,067 |
| BOKF, National Association | 1500 North Central Expressway Mckinney, TX 75070 | Full Service B&M | $73,058 |
| BOKF, National Association | 1505 Pearl Street # 105 Boulder, CO 80302 | Full Service B&M | $24,947 |
| BOKF, National Association | 1520 North 9th St Broken Arrow, OK 74012 | Full Service B&M | $72,912 |
| BOKF, National Association | 15245 Southwest Freeway Sugar Land, TX 77478 | Full Service B&M | $176,111 |
| BOKF, National Association | 15490 East Hampden Avenue Aurora, CO 80013 | Full Service B&M | $39,327 |
| BOKF, National Association | 15725 Cypresswood Medical Drive Houston, TX 77014 | Full Service B&M | $75,634 |
| BOKF, National Association | 1600 Broadway Denver, CO 80202 | Full Service B&M | $1,017,492 |
| BOKF, National Association | 1604 North Lewis Tulsa, OK 74110 | Full Service B&M | $19,802 |
| BOKF, National Association | 1644 24th Ave Nw, Ste 104 Norman, OK 73069 | Full Service Retail | $25,076 |
| BOKF, National Association | 1698 Rio Bravo, S.W., Suite H Albuquerque, NM 87105 | Full Service B&M | $12,962 |
| BOKF, National Association | 1710 Ne Douglas St Lees Summit, MO 64086 | Full Service B&M | $3,238 |
| BOKF, National Association | 17821 Cottonwood Drive Parker, CO 80134 | Full Service B&M | $15,321 |
| BOKF, National Association | 1790 Hughes Landing Blvd., Suite 150 The Woodlands, TX 77380 | Full Service B&M | $1,551 |
| BOKF, National Association | 19201 E. Mainstreet Parker, CO 80134 | Full Service B&M | $64,504 |
| BOKF, National Association | 201 South Main Street Grove, OK 74344 | Full Service B&M | $48,224 |
| BOKF, National Association | 201 Wadsworth Boulevard Lakewood, CO 80226 | Full Service B&M | $33,274 |
| BOKF, National Association | 201 West Twelfth Street Dallas, TX 75208 | Full Service B&M | $32,504 |
| BOKF, National Association | 2021 South Lewis Avenue Tulsa, OK 74104 | Full Service B&M | $84,547 |
| BOKF, National Association | 2100 West Houston Broken Arrow, OK 74012 | Full Service B&M | $103,466 |
| BOKF, National Association | 215 State Street Muskogee, OK 74401 | Full Service B&M | $231,146 |
| BOKF, National Association | 219 South Main Eufaula, OK 74432 | Full Service B&M | $35,663 |
| BOKF, National Association | 2250 State Highway 114 West Grapevine, TX 76051 | Full Service B&M | $38,148 |
| BOKF, National Association | 2308 North Van Buren Street Enid, OK 73703 | Full Service B&M | $77,095 |
| BOKF, National Association | 250 N. Rock Road Wichita, KS 67206 | Full Service B&M | $0 |
| BOKF, National Association | 2500 Louisiana Boulevard, N.E. Albuquerque, NM 87110 | Full Service B&M | $91,916 |
| BOKF, National Association | 2601 North Meridian Oklahoma City, OK 73107 | Full Service B&M | $60,954 |
| BOKF, National Association | 2650 Royal Lane Dallas, TX 75229 | Full Service B&M | $182,936 |
| BOKF, National Association | 300 North 32nd Street Muskogee, OK 74401 | Full Service B&M | $39,542 |
| BOKF, National Association | 3001 East Cambelback Road Phoenix, AZ 85016 | Full Service B&M | $487,264 |
| BOKF, National Association | 3037 S. Garnett Road Tulsa, OK 74129 | Full Service B&M | $67,870 |
| BOKF, National Association | 3045 South Harvard Ave Tulsa, OK 74114 | Full Service B&M | $122,563 |
| BOKF, National Association | 307 West Washington, Suite 200 Sherman, TX 75090 | Full Service B&M | $99,373 |
| BOKF, National Association | 320 South Boston Avenue Tulsa, OK 74103 | Full Service B&M | $52,452 |
| BOKF, National Association | 3200 Heritage Trace Parkway Fort Worth, TX 76177 | Full Service B&M | $24,298 |
| BOKF, National Association | 3237 South Peoria Avenue Tulsa, OK 74105 | Full Service B&M | $243,540 |
| BOKF, National Association | 3301 Coors Boulevard, N.W. Albuquerque, NM 87120 | Full Service B&M | $31,680 |
| BOKF, National Association | 333 West Campbell Road Richardson, TX 75080 | Full Service B&M | $251,556 |
| BOKF, National Association | 3500 North College Ave Fayetteville, AR 72703 | Full Service B&M | $185,684 |
| BOKF, National Association | 3545 Ellicott Mills Drive Ellicott City, MD 21043 | Limited, Drive-thru | $0 |
| BOKF, National Association | 3550 West Main St Norman, OK 73072 | Full Service B&M | $121,038 |
| BOKF, National Association | 3610 East First Avenue Denver, CO 80206 | Full Service B&M | $100,127 |
| BOKF, National Association | 3800 North Macarthur Blvd Warr Acres, OK 73122 | Full Service Retail | $22,358 |
| BOKF, National Association | 3815 South East Frank Phillips Boulevard Bartlesville, OK 74006 | Full Service B&M | $53,961 |
| BOKF, National Association | 3901 Southern Boulevard, S.E. Rio Rancho, NM 87124 | Full Service B&M | $82,365 |
| BOKF, National Association | 3908 Telephone Road Lake Worth, TX 76135 | Full Service B&M | $62,623 |
| BOKF, National Association | 400 Coit Road Plano, TX 75075 | Full Service B&M | $28,176 |
| BOKF, National Association | 400 Tijeras Avenue Nw, Suite 150 Albuquerque, NM 87102 | Full Service B&M | $855,550 |
| BOKF, National Association | 4000 Macarthur Blvd. Suite 600 Newport Beach, CA 92658 | Limited, Trust Office | $0 |
| BOKF, National Association | 401 Coors Boulevard Nw Albuquerque, NM 87121 | Full Service B&M | $25,724 |
| BOKF, National Association | 401 East Broadway Sand Springs, OK 74063 | Full Service B&M | $78,202 |
| BOKF, National Association | 4140 West 71st Street Prairie Village, KS 66208 | Full Service B&M | $10,056 |
| BOKF, National Association | 420 North Robinson Ave Oklahoma City, OK 73102 | Limited, Drive-thru | $0 |
| BOKF, National Association | 4262 Live Oak Street Dallas, TX 75204 | Full Service B&M | $55,736 |
| BOKF, National Association | 4324 Southeast 44th Street Del City, OK 73135 | Full Service B&M | $28,550 |
| BOKF, National Association | 4544 South 33rd West Avenue Tulsa, OK 74107 | Full Service B&M | $35,893 |
| BOKF, National Association | 4555 Sweetwater Boulevard Sugar Land, TX 77479 | Full Service B&M | $37,246 |
| BOKF, National Association | 4700 Montgomery Boulevard Northeast Albuquerque, NM 87109 | Full Service B&M | $28,667 |
| BOKF, National Association | 4901 East Central Avenue, N.E. Albuquerque, NM 87108 | Full Service B&M | $49,283 |
| BOKF, National Association | 499 W. Sheridan Ave Oklahoma City, OK 73102 | Full Service B&M | $1,872,674 |
| BOKF, National Association | 500 Chimney Rock Houston, TX 77056 | Full Service B&M | $1,119,657 |
| BOKF, National Association | 500 Grapevine Highway Hurst, TX 76054 | Full Service B&M | $91,749 |
| BOKF, National Association | 5320 Bellaire Boulevard Bellaire, TX 77401 | Full Service B&M | $110,773 |
| BOKF, National Association | 5500 Kirby Drive Houston, TX 77005 | Full Service B&M | $52,603 |
| BOKF, National Association | 5509 North Pennsylvania Avenue Oklahoma City, OK 73112 | Full Service B&M | $76,584 |
| BOKF, National Association | 555 West Grand Parkway South Katy, TX 77494 | Full Service B&M | $39,597 |
| BOKF, National Association | 5727 South Lewis Avenue Tulsa, OK 74105 | Full Service B&M | $38,073 |
| BOKF, National Association | 5909 Camp Bowie Fort Worth, TX 76107 | Full Service B&M | $31,539 |
| BOKF, National Association | 5910 South University Blvd., Suite C-16 Greenwood Village, CO 80121 | Full Service B&M | $58,655 |
| BOKF, National Association | 5915 Wyoming Boulevard, N.E. Albuquerque, NM 87109 | Full Service B&M | $91,001 |
| BOKF, National Association | 5956 Sherry Ln., Ste 1100 Dallas, TX 75225 | Full Service B&M | $2,386,900 |
| BOKF, National Association | 600 Penn St. Fort Worth, TX 76102 | Full Service B&M | $588,720 |
| BOKF, National Association | 6036 South Yale Avenue Tulsa, OK 74135 | Full Service B&M | $151,847 |
| BOKF, National Association | 6105 W. Park Blvd. Plano, TX 75093 | Full Service B&M | $36,183 |
| BOKF, National Association | 6201 Hillcrest Avenue Dallas, TX 75205 | Full Service B&M | $42,916 |
| BOKF, National Association | 634 Becker Avenue Belen, NM 87002 | Full Service B&M | $38,095 |
| BOKF, National Association | 645 Main Street, N.E. Los Lunas, NM 87031 | Full Service B&M | $30,292 |
| BOKF, National Association | 6505 East 101st Street South Tulsa, OK 74133 | Full Service B&M | $140,501 |
| BOKF, National Association | 6517 Nw Expressway Oklahoma City, OK 73132 | Full Service B&M | $48,131 |
| BOKF, National Association | 6530 Paradise Blvd Albuquerque, NM 87114 | Full Service B&M | $18,669 |
| BOKF, National Association | 6600 North Fourth Street, N.W. Albuquerque, NM 87107 | Full Service B&M | $53,398 |
| BOKF, National Association | 6701 Preston Road Dallas, TX 75205 | Full Service B&M | $61,111 |
| BOKF, National Association | 7 West 62nd Terrace Kansas City, MO 64113 | Full Service B&M | $8,205 |
| BOKF, National Association | 7000 E. Mayo Blvd # 22 Phoenix, AZ 85054 | Full Service B&M | $21,284 |
| BOKF, National Association | 706a St. Michael's Drive Santa Fe, NM 87505 | Full Service B&M | $21,792 |
| BOKF, National Association | 7110 S. Olympia Avenue West Tulsa, OK 74132 | Full Service B&M | $57,179 |
| BOKF, National Association | 7121 South Sheridan Road Tulsa, OK 74133 | Full Service B&M | $78,089 |
| BOKF, National Association | 7600 West Northwest Highway Dallas, TX 75225 | Limited, Drive-thru | $63,440 |
| BOKF, National Association | 7701 South Western Avenue Oklahoma City, OK 73139 | Full Service B&M | $57,966 |
| BOKF, National Association | 792 Watters Road Allen, TX 75013 | Full Service B&M | $27,100 |
| BOKF, National Association | 7923 East 51st Street Tulsa, OK 74145 | Full Service Retail | $27,415 |
| BOKF, National Association | 8095 E Belleview Avenue Englewood, CO 80111 | Full Service B&M | $25,042 |
| BOKF, National Association | 8221 Wyoming Boulevard Ne Albuquerque, NM 87113 | Full Service B&M | $57,117 |
| BOKF, National Association | 8277 Walnut Hill Lane Dallas, TX 75231 | Full Service B&M | $43,661 |
| BOKF, National Association | 851 N Macarthur Blvd. Coppell, TX 75019 | Full Service B&M | $22,140 |
| BOKF, National Association | 900 South Kansas Avenue, Suite 100 Topeka, KS 66612 | Limited, Trust Office | $0 |
| BOKF, National Association | 901 Dobson Mesa, AZ 85201 | Full Service B&M | $92,899 |
| BOKF, National Association | 9300 North Pennsylvania Oklahoma City, OK 73120 | Full Service B&M | $60,029 |
| BOKF, National Association | 9520 South Delaware Ave Tulsa, OK 74137 | Full Service B&M | $65,867 |
| BOKF, National Association | 9545 W. Camelback Phoenix, AZ 85037 | Full Service B&M | $6,872 |
| BOKF, National Association | 9561 S. University Blvd Highlands Ranch, CO 80126 | Full Service B&M | $61,128 |
| BOKF, National Association | 9580 North Garnett Road Owasso, OK 74055 | Full Service B&M | $88,517 |
| BOKF, National Association | One East Choctaw Mcalester, OK 74501 | Full Service B&M | $34,539 |
| BOKF, National Association | One Williams Center Tulsa, OK 74172 | Full Service B&M | $6,317,159 |
For 2018, Bokf had 133 branches.
Yearly Performance Overview
Bank Income
| Item | Value (in 000's) |
|---|---|
| Total interest income | $1,181,727 |
| Net interest income | $948,276 |
| Total noninterest income | $513,343 |
| Gross Fiduciary activities income | $158,473 |
| Service charges on deposit accounts | $89,378 |
| Trading account gains and fees | $23,618 |
| Additional Noninterest Income | $241,874 |
| Pre-tax net operating income | $571,001 |
| Securities gains (or losses, -) | $-932 |
| Income before extraordinary items | $446,919 |
| Discontinued Operations (Extraordinary gains, net) | $0 |
| Net income of bank and minority interests | $446,919 |
| Minority interest net income | $96 |
| Net income | $446,823 |
| Sale, conversion, retirement of capital stock, net | $3,458 |
| Net operating income | $447,655 |
Bokf's gross interest income from loans was $1,181,727,000.
Bokf's net interest income from loans was $948,276,000.
Bokf's fee based income from loans was $89,378,000.
Bokf's net income from loans was $446,823,000.
Bank Expenses
| Item | Value (in 000's) |
|---|---|
| Total interest expense | $233,451 |
| Provision for credit losses | $9,944 |
| Total noninterest expense | $880,674 |
| Salaries and employee benefits | $514,566 |
| Premises and equipment expense | $91,005 |
| Additional noninterest expense | $275,103 |
| Applicable income taxes | $123,150 |
| Net charge-offs | $33,169 |
| Cash dividends | $425,000 |
Bokf's interest expense for loans was $233,451,000.
Bokf's payroll and benefits expense were $514,566,000.
Bokf's property, plant and equipment expenses $91,005,000.
Loan Performance
| Type of Loan | % of Loans Noncurrent (30+ days, end of period snapshot) |
|---|---|
| All loans | 1.0% |
| Real Estate loans | 1.0% |
| Construction & Land Development loans | 1.0% |
| Nonfarm, nonresidential loans | 0.0% |
| Multifamily residential loans | 0.0% |
| 1-4 family residential loans | 6.0% |
| HELOC loans | 0.0% |
| All other family | 7.0% |
| Commercial & industrial loans | 0.0% |
| Personal loans | 0.0% |
| Credit card loans | 0.0% |
| Other individual loans | 0.0% |
| Auto loans | 0.0% |
| Other consumer loans | 0.0% |
| Unsecured commercial real estate loans | 0.0% |
Deposits
| Type | Value (in 000's) |
|---|---|
| Total deposits | $22,175,620 |
| Deposits held in domestic offices | $22,175,620 |
| Deposits by Individuals, partnerships, and corporations | $20,521,420 |
| Deposits by U.S. Government | $4,394 |
| Deposits by States and political subdivisions in the U.S. | $1,455,495 |
| Deposits by Commercial banks and other depository institutions in U.S. | $194,311 |
| Deposits by Banks in foreign countries | $0 |
| Deposits by Foreign governments and official institutions | $0 |
| Transaction accounts | $4,396,982 |
| Demand deposits | $2,186,811 |
| Nontransaction accounts | $17,778,638 |
| Money market deposit accounts (MMDAs) | $15,229,479 |
| Other savings deposits (excluding MMDAs) | $505,470 |
| Total time deposits | $2,043,689 |
| Total time and savings deposits | $19,988,809 |
| Noninterest-bearing deposits | $2,186,811 |
| Interest-bearing deposits | $19,988,809 |
| Retail deposits | $20,445,399 |
| IRAs and Keogh plan accounts | $275,183 |
| Brokered deposits | $1,078,780 |
| Deposits held in foreign offices | $0 |
Assets
| Asset | Value (in 000's) |
|---|---|
| Total Assets | $34,104,022 |
| Cash & Balances due from depository institutions | $1,256,897 |
| Interest-bearing balances | $391,098 |
| Total securities | $9,114,602 |
| Federal funds sold & reverse repurchase | $6,561 |
| Net loans and leases | $18,637,162 |
| Loan and leases loss allowance | $207,457 |
| Trading account assets | $2,284,588 |
| Bank premises and fixed assets | $270,958 |
| Other real estate owned | $11,170 |
| Goodwill and other intangibles | $694,390 |
| All other assets | $1,827,694 |
Liabilities
| Liabilities | Value (in 000's) |
|---|---|
| Total liabilities and capital | $34,104,022 |
| Total Liabilities | $30,857,009 |
| Total deposits | $22,175,620 |
| Interest-bearing deposits | $19,988,809 |
| Deposits held in domestic offices | $22,175,620 |
| % insured (estimated) | $49 |
| Federal funds purchased and repurchase agreements | $1,525,104 |
| Trading liabilities | $181,442 |
| Other borrowed funds | $6,303,354 |
| Subordinated debt | $0 |
| All other liabilities | $671,489 |
Issued Loan Types
| Type | Value (in 000's) |
|---|---|
| Net loans and leases | $18,637,162 |
| Loan and leases loss allowance | $207,457 |
| Total loans and leases (domestic) | $18,844,619 |
| All real estate loans | $9,549,110 |
| Real estate loans in domestic offices | $9,549,110 |
| Construction and development loans | $1,151,733 |
| Residential 1-4 family construction | $62,509 |
| Other construction, all land development and other land | $1,089,224 |
| Loans secured by nonfarm nonresidential properties | $5,211,208 |
| Nonfarm nonresidential secured by owner-occupied properties | $1,394,099 |
| Commercial real estate & other non-farm, non-residential | $3,817,109 |
| Multifamily residential real estate | $950,715 |
| 1-4 family residential loans | $2,211,744 |
| Farmland loans | $23,710 |
| Loans held in foreign offices | $0 |
| Farm loans | $13,446 |
| Commercial and industrial loans | $7,631,906 |
| To non-U.S. addressees | $15,186 |
| Loans to individuals | $404,211 |
| Credit card loans | $0 |
| Related Plans | $11,820 |
| Consumer Auto Loans | $61,428 |
| Other loans to individuals | $330,963 |
| All other loans & leases | $1,284,401 |
| Loans to foreign governments and official institutions | $0 |
| Other loans | $355,837 |
| Loans to depository institutions and acceptances of other banks | $8,057 |
| Loans not secured by real estate | $2,180 |
| Loans secured by real estate to non-U.S. addressees | $0 |
| Restructured Loans & leases | $25,789 |
| Non 1-4 family restructured loans & leases | $0 |
| Total loans and leases (foreign) | $0 |
BOKF had $18,637,162,000 of loans outstanding in 2018. $9,549,110,000 of loans were in real estate loans. $1,151,733,000 of loans were in development loans. $950,715,000 of loans were in multifamily mortgage loans. $2,211,744,000 of loans were in 1-4 family mortgage loans. $13,446,000 of loans were in farm loans. $0 of loans were in credit card loans. $61,428,000 of loans were in the auto loan category.
Small Business Loans
| Categorization | # of Loans in Category | $ amount of loans (in 000's) | Average $/loan |
|---|---|---|---|
| Nonfarm, nonresidential loans - <$1MM | 789 | $241,925 | $306,622 |
| Nonfarm, nonresidential loans - <$100k | 97 | $2,188 | $22,557 |
| Nonfarm, nonresidential loans - $100-250k | 168 | $19,193 | $114,244 |
| Nonfarm, nonresidential loans - $250k-1MM | 524 | $220,544 | $420,885 |
| Commercial & Industrial, US addressed loans - <$1MM | 2,644 | $263,889 | $99,807 |
| Commercial & Industrial, US addressed loans - <$100k | 1,590 | $21,559 | $13,559 |
| Commercial & Industrial, US addressed loans - $100-250k | 429 | $34,581 | $80,608 |
| Commercial & Industrial, US addressed loans - $250k-1MM | 625 | $207,749 | $332,398 |
| Farmland loans - <$1MM | 4 | $315 | $78,750 |
| Farmland loans - <$100k | 1 | $8 | $8,000 |
| Farmland loans - $100-250k | 2 | $134 | $67,000 |
| Farmland loans - $250k-1MM | 1 | $173 | $173,000 |
| Agriculture operations loans - <$1MM | 8 | $655 | $81,875 |
| Agriculture operations loans - <$100k | 5 | $16 | $3,200 |
| Agriculture operations loans - $250k-1MM | 3 | $639 | $213,000 |
